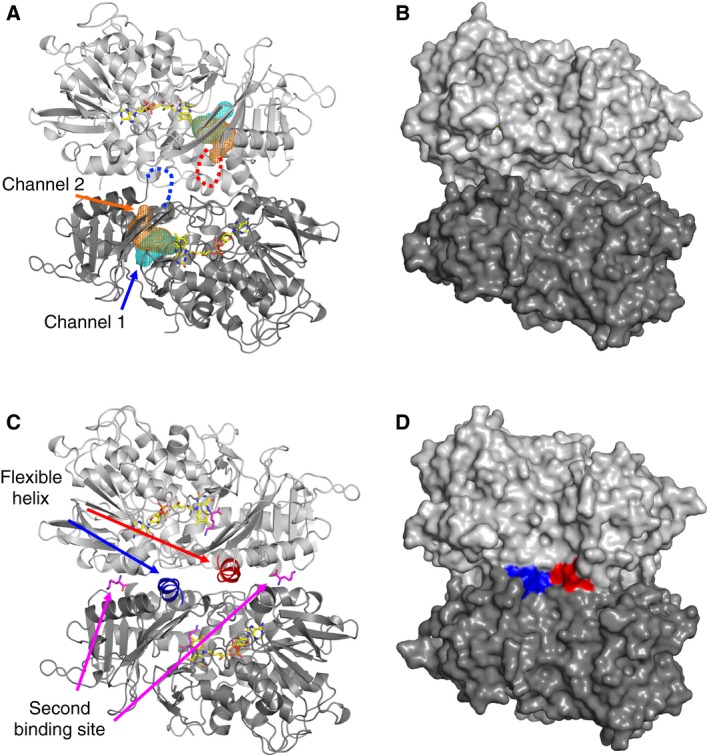
Figure 6.

Dimer structures of (A, B) ligand‐free and (C, D) l‐Lys complexed with l‐ AAO/MOG shown by (A, C) cartoon and (B, D) surface representations. Flexible helices at the dimer interface are shown as blue and red. Dotted lines in (A) indicate that this region is disordered in the ligand‐free structure. Channel 1 (cyan) and channel 2 (orange) are shown as mesh in (A). l‐Lys and FAD molecules are shown as magenta and yellow sticks, respectively, in (A and C).
