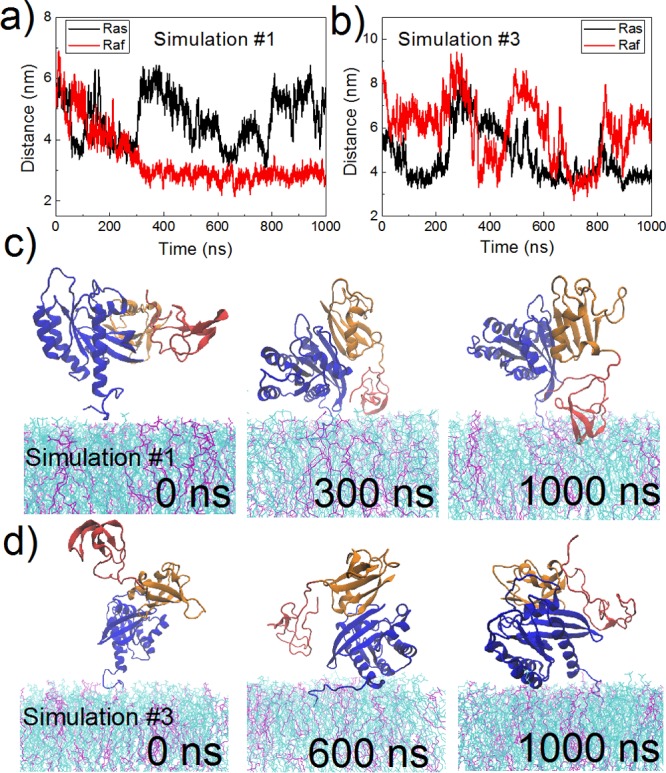
Figure 3.

Membrane binding dynamics of the C-Raf–K-Ras4B complex. (a–b) Time evolution of the distance of the center of K-Ras4B CD2 (residues 87–166) or the center of C-Raf CRD to the membrane center. Snapshots taken at various time points from (c) simulation #1 and (d) simulation #3. Color scheme is the same as in Figure 1 except POPC is in cyan, and POPS is in purple.
