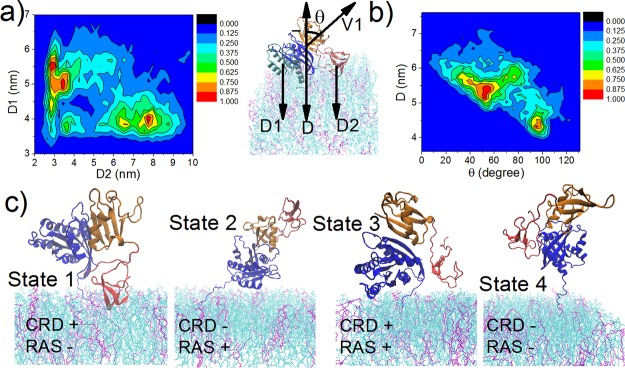
Figure 5.
Configurations of the C-Raf–K-Ras4B complex at the membrane. The variables are defined as follows: D1, distance of K-Ras4B CD2, and D2, distance of CRD to membrane center, respectively. D, distance between the center of RBD–K-Ras4BCD1 and membrane center. V1, vector connecting the center of K-Ras4B CD1 to center of the RBD. θ, cross angle between vector V1 and normal to the membrane surface. K-Ras4B CD1, CD2, RBD, CRD in cyan, blue, orange, and red, respectively. (a) Contour maps (scaled to max.) with variables D1 versus D2. (b) D versus θ. (c) Representative configurations for the four possible states of the C-Raf–K-Ras4B complex. +/− denotes whether the domain binds the membrane or not.

