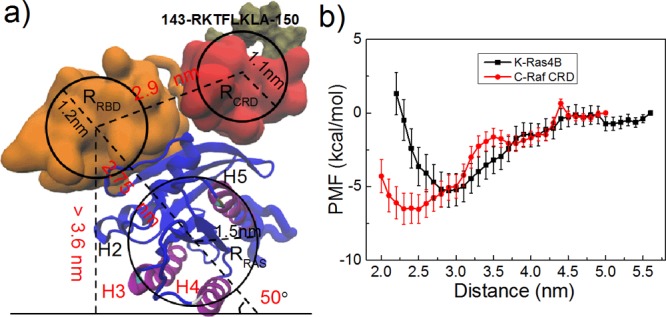
Figure 6.

Tug of war between K-Ras4B and C-Raf CRD membrane interactions. (a) Schematic picture of steric/geometric limitations of the C-Raf–K-Ras4B complex in different states (here state 2; see Supporting Information, Figure S8 for state 1). (b) Potential of mean force, PMF, for K-Ras4B and CRD binding to the model membrane.
