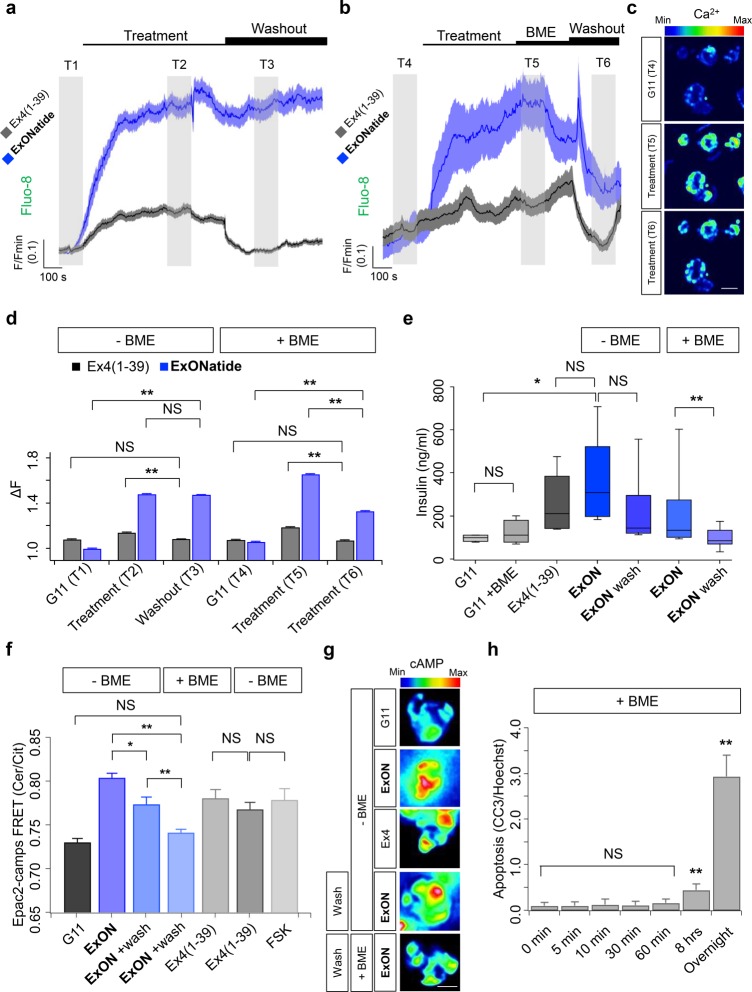
Figure 3.
ExONatide leads to prolonged Ca2+ and cAMP signaling. (a) ExONatide induces Ca2+ rises in MIN6B1-SNAP_GLP-1R cells similarly to Ex4(1–39), but this cannot be washed out with buffer (mean ± SEM traces shown) (gray shaded area T1-T3 = analysis time window) (n = 29–34 cells). (b) Application of beta-mercaptoethanol (BME) for 5 min immediately prior to washout allows Ca2+ responses to ExONatide to be subsequently reduced (mean ± SEM traces shown) (gray shaded area T4–T6 = analysis time window) (n = 34 cells). (c) Representative images showing Ca2+ responses to ExONatide in MIN6B1-SNAP_GLP-1R cells before (T4), during (T5) and after (T6) application of BME. (d) Bar graph showing amplitude of Ca2+ responses to Ex4(1–39) and ExONatide before and after washout ± BME (n = 29–34 cells) (T1-T6 relate to time windows shown in a and b). (e) Box and whiskers plot showing that ExONatide-stimulated insulin secretion can only be washed out following application of BME (n = 8 wells) (Ex4(1–39)-alone was used as a positive control) (G11; 11 mM glucose). (f) As for (a), but FRET assays for intracellular cAMP 15 min following application of ligand or washout (n = 40–71 cells). (g) Representative images showing FRET responses to ExONatide in MIN6B1-SNAP_GLP-1R cells before and after application of BME. (h) BME was unable to significantly induce apoptosis over 60 min, as determined using immunostaining for cleaved caspase 3 (CC3) (overnight incubation serves as the positive control) (n = 3 experiments). **P < 0.01 and NS, nonsignificant, as indicated or vs control; Student’s t test, one-way ANOVA (with Bonferroni’s or Tukey’s posthoc test) or Kruskal–Wallis test (with Dunn’s multiple comparison test). ExONatide and Ex4(1–39) were applied at 800 nM and 10 nM, respectively. BME was applied at 10 mM. Values are the mean ± SEM unless otherwise stated.

