Figure 6.
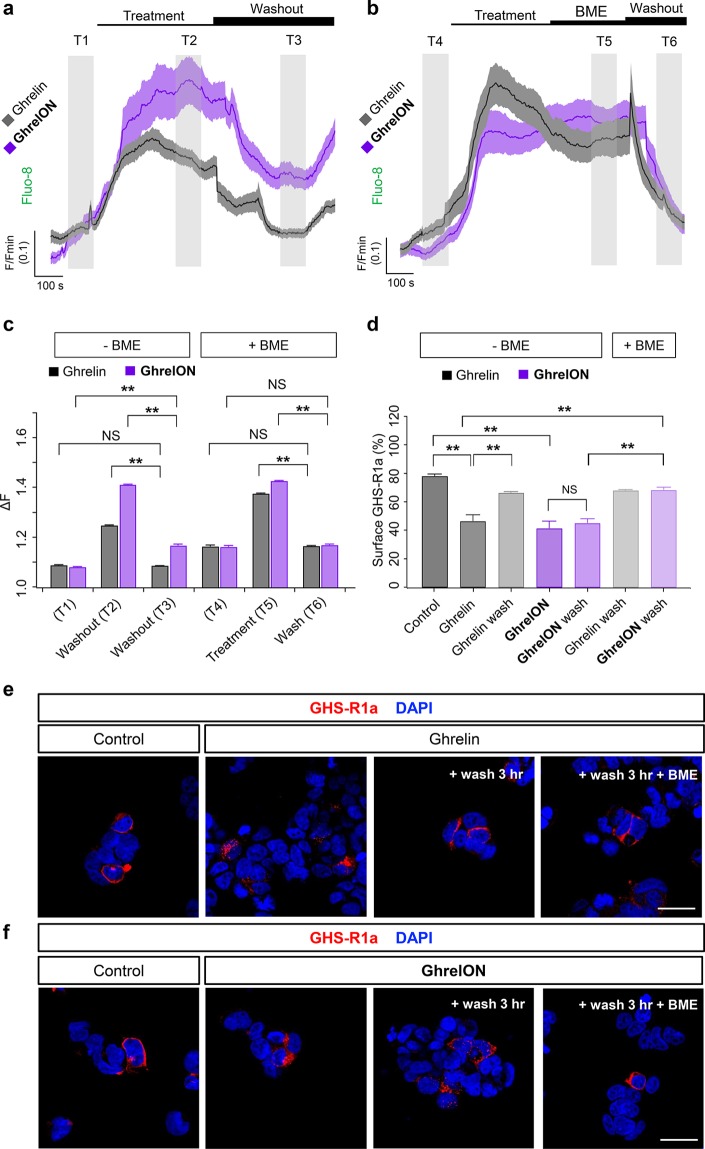
GhrelON reversibly activates and internalizes the GHS-R1a. (a) Both ghrelin and GhrelON induce large increases in intracellular Ca2+ concentrations in YFP-AD293-SNAP_GHS-R1a, although washout of ligand only restores baseline Ca2+ levels for ghrelin (mean ± SEM traces shown) (gray shaded area T1–T3 = analysis time window) (n = 27–54 cells). (b) Application of beta-mercaptoethanol (BME) for 5 min immediately prior to washout reduces Ca2+ responses to GhrelON to baseline levels (mean ± SEM traces shown) (gray shaded area T4-T6 = analysis time window) (n = 27–54 cells). (c) Bar graph showing amplitude of Ca2+ responses to ghrelin and GhrelON before and after washout ± BME (n = 27–54 cells) (T1–T6 relate to time windows shown in a and b). (d) Treatment of YFP-AD293-SNAP_GHS-R1a cells with ghrelin for 1 h leads to GHS-R1a internalization, which can be partially reversed following washout and incubation for a further 3 h. GhrelON exerts similar effects, but these can only be washed out following prior application of BME for 10 min (n = 10–12 images from two experiments). (e) Representative images showing that ghrelin reduces surface GHS-R1a expression (detected via the FLAG-tag), which is reversed by a wash step (scale bar = 33 μm). f) As for (e), but showing that plasma membrane GHS-R1a recycling can only be achieved by application of BME to GhrelON-treated YFP-AD293-SNAP_GHS-R1a cells. **P < 0.01 and NS, nonsignificant, as indicated; Student’s t test or one-way ANOVA (with Bonferroni’s posthoc test). Ghrelin and GhrelON were applied at 100 nM and 800 nM, respectively. BME was applied at 10 mM. Values are the mean ± SEM.

