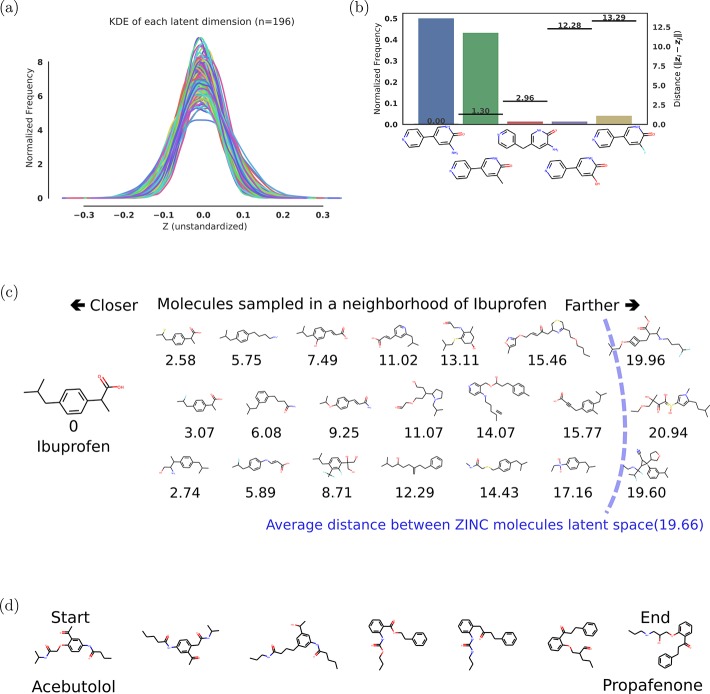
Figure 2.
Representations of the sampling results from the variational autoencoder. (a) Kernel Density Estimation (KDE) of each latent dimension of the autoencoder, i.e., the distribution of encoded molecules along each dimension of our latent space representation; (b) histogram of sampled molecules for a single point in the latent space; the distances of the molecules from the original query are shown by the lines corresponding to the right axis; (c) molecules sampled near the location of ibuprofen in latent space. The values below the molecules are the distance in latent space from the decoded molecule to ibuprofen; (d) slerp interpolation between two molecules in latent space using six steps of equal distance.

