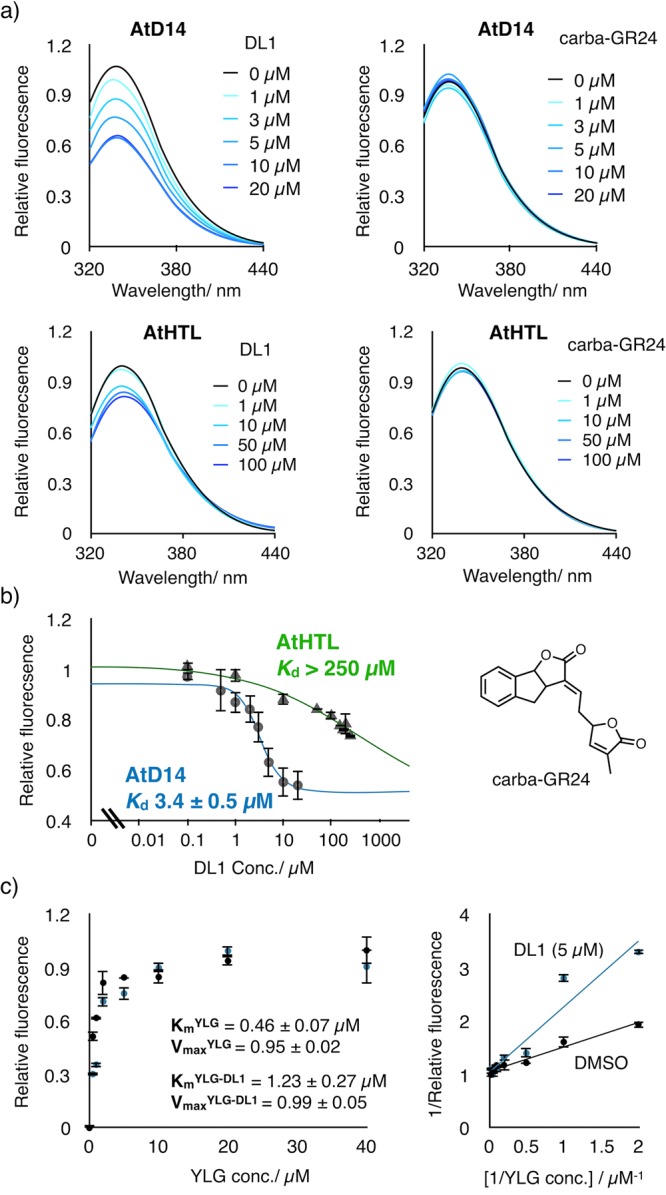
Figure 2.

Biochemical analysis for the AtD14 inhibition by DL1. (a) Quenching of AtD14 or AtHTL intrinsic fluorescence by DL1. The intrinsic fluorescence of AtD14 and AtHTL was measured in the presence of DL1 or carba-GR24 at the indicated concentration (ex. 288 nm). (b) The relative fluorescence intensity of AtD14 (blue) and AtHTL (green) at 340 nm was plotted against DL1 concentrations. Error bar indicates SE (n = 3 biological replicates). (c) Michaelis–Menten (left) and Lineweaver–Burk plots (right) for the inhibition of AtD14 by DL1 (5 μM). Km and Vmax values were calculated by using the linear least-square method. Error bar indicates SE (n = 3 biological replicates).
