Figure 7.

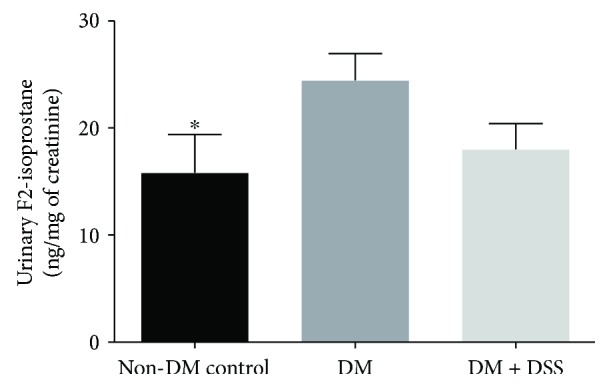
The urinary F2-isoprostane concentration of mice at after 3 weeks of intervention. ∗ denotes p < 0.05 when compared to the DM group.

The urinary F2-isoprostane concentration of mice at after 3 weeks of intervention. ∗ denotes p < 0.05 when compared to the DM group.