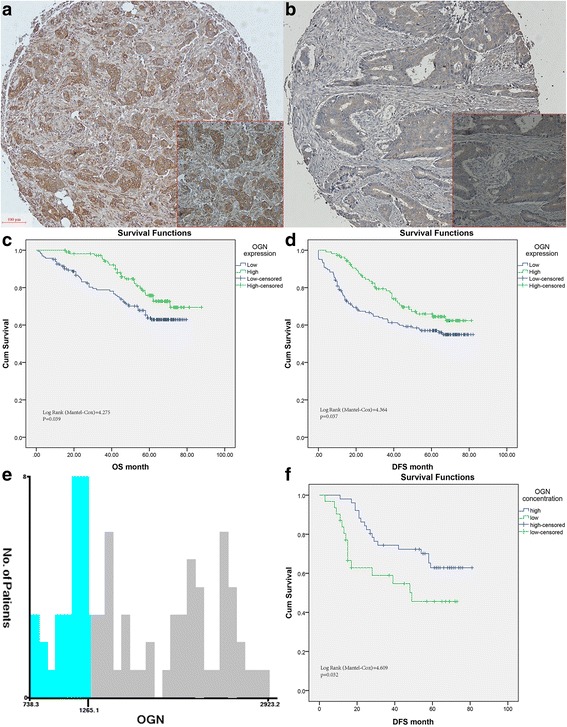
Fig. 1.

Characteristic expression pattern of OGN in human colorectal cancers. a High immunohistochemical staining of OGN in the cytoplasm of cancer cells in TMA samples. The representative pictures of low expression of OGN were also shown (b). c Kaplan Meier curves for overall survival for High OGN expression versus Low expression group. d Disease-free survival for High OGN expression versus Low expression group. e The optimal cut-off values of serum OGN levels are shown in histograms of the entire cohort (12.65 ng/ml). f Disease-free survival for high serum OGN level versus low serum level group
