
Fig. 4.
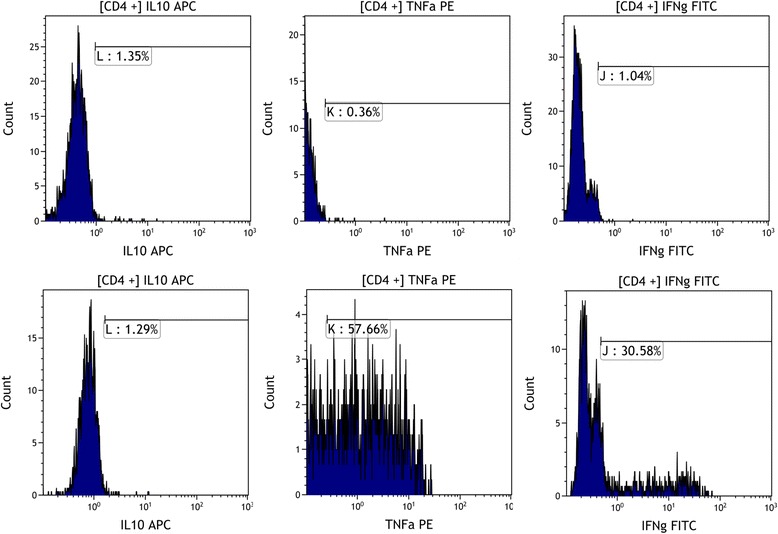
Top panel: Flow cytometry report showing unstimulated CD3+ CD8- (CD4+) T-lymphocytes. Correct gating on these cells allows for accurate positioning of the corresponding stimulated cell profile on middle panel. Thus the ratio of TNFa and IFNg expression to IL-10 expression can be calculated. In this case IL-10: TNFa is 1:43 and IL-10 to IFNg is 1:22. The lower panel indicates a typical response seen in a nutrient “responder” with an increase in IL-10 and a decrease in levels of response to TNFa and IFNg