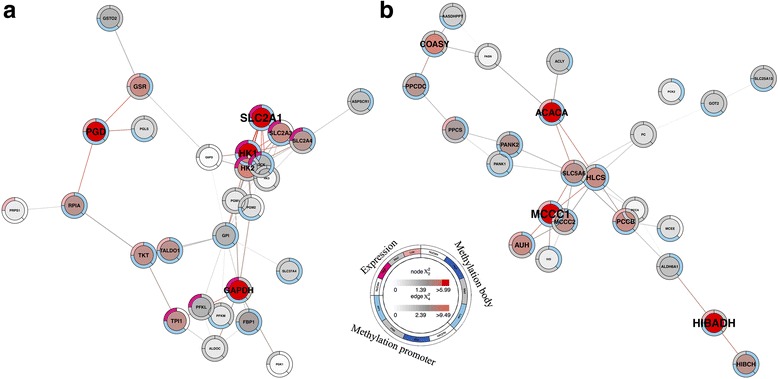
Fig. 3.

Example SMITE modules. a Cluster 2 module 6 (N = 28 genes; p = 0.02) built around SLC2A1 and HK1 genes and involved in carbohydrate metabolism. b Cluster 3 module 11 (N = 25 genes; p = 0.04) built around MCCC1 and ACACA genes and involved in amino acid and biotin metabolism. Expression is displayed on the top left edge of each gene circle (upregulated: dark pink; downregulated: light pink; gray: not significant; white: no data), and combined promoter and body methylation are displayed on the bottom left and top right of each circle, respectively (hypermethylated: dark blue; hypomethylated: light blue; gray: not significant; white: no data), compared to cluster 1. The symbol text sizes and center node colors are based on the total gene score (low (gray) to high (red)) and the edge colors are representative of the strength of the associations between the genes (low (gray) to high (red)). The remaining modules are shown in Additional file 11: Figure S4 and Additional file 14: Figure S5
