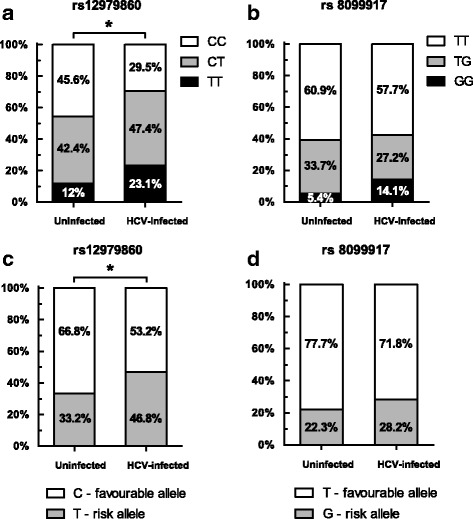
Fig. 1.

IL28B polymorphisms in a Uruguayan HCV-infected population (n = 78) and a Uruguayan uninfected population (n = 92). a SNP rs12979860 genotype distribution, where CC is considered as the good genotype and CT/TT as the unfavourable genotypes. The difference between groups is statistically significant (χ2 test - codominant model, p = 0.045). b SNP rs8099917 genotype distribution, where TT is considered as the good genotype and TG/GG as the unfavourable genotypes. c SNP rs12979860 allelic distribution. The distribution between both populations is statistically significant (χ2 test, p = 0.010). d SNP rs8099917 allelic distribution
