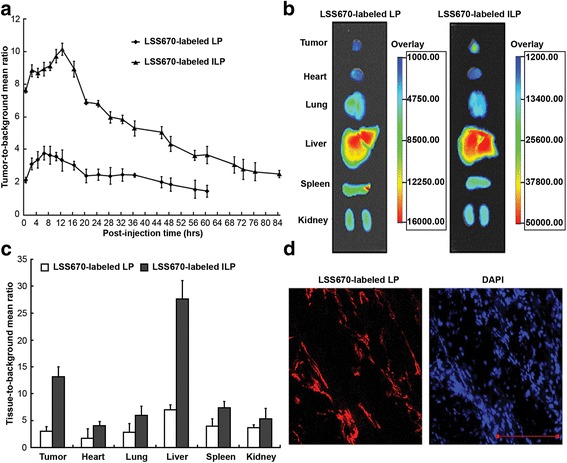
Fig. 6.

In vivo fluorescence distribution in the mouse xenograft model. a Normalized fluorescence of LSS670-labeled Lp and ILp in the mouse xenograft model (n = 4) as a function of time. Normalized fluorescence signals (i.e., tumor-to-background signal ratios) were calculated by dividing the total fluorescence intensity in the tumor by the background intensity. b & c Biodistribution data at 12 h post injection of LSS670 labeled-Lp and ILp in nude mice bearing MDA-MB-231-Luc breast cancer xenografts. d Two-color confocal microscopy images of 5-μm sections of frozen tumor tissues harvested 12 h after injection of LSS670-labeled ILp. DAPI, blue); LSS670-labeled ILp, red). Scale bar: 100 μm
