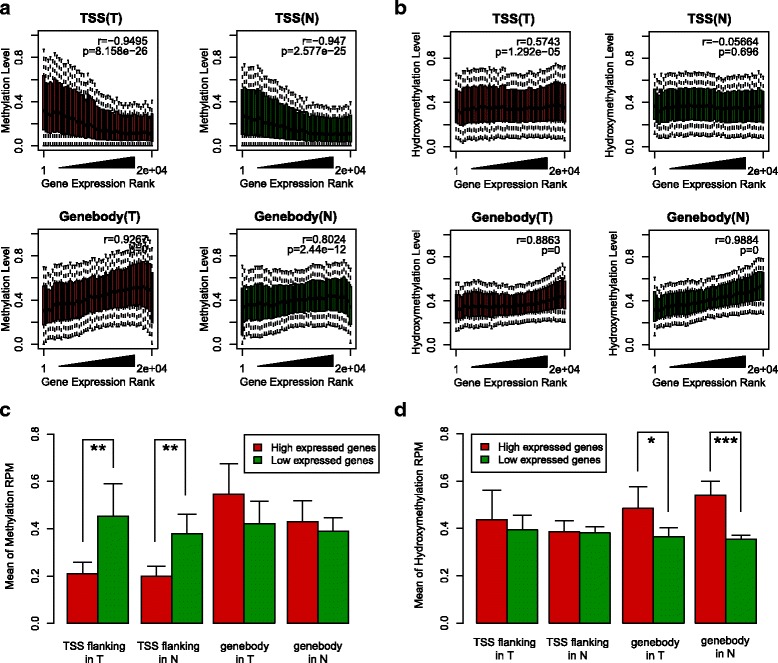
Fig. 3.

Association between epigenomic modification and gene expression. a, b Correlations between epigenomic modification (a is 5-mC, b is 5-hmC) and gene expression in TSS (defined as − 500 bp to + 500 bp across TSS) and genebody respectively. For Medip, there is a clear anti-correlation of gene expression in TSS and a positive correlation in the genebody. For hMedip, only positive correlations in the genebody can be observed. c 5-mC is enriched in the TSS flanking region (defined as − 500 bp to + 500 bp across TSS) of lowly expressed genes in both despite normal and tumor tissues. d 5-hmC is enriched in the genebody region of highly expressed genes in both normal and tumor tissues
