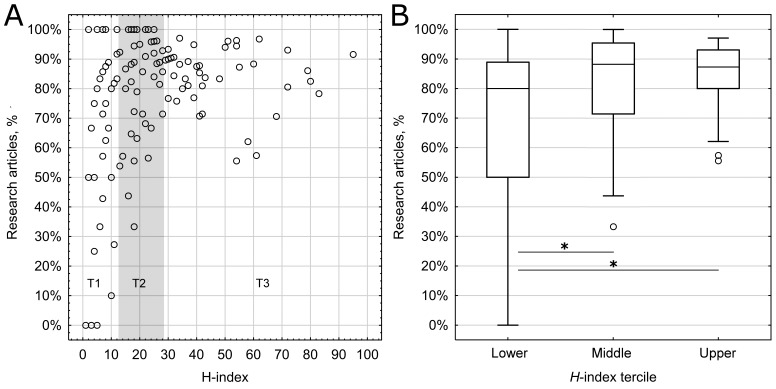
Figure 1.
Contribution of research articles to h-index. A. Scatterplot of percentage of research articles among publications contributing to h-index of members of selected medical societies vs their h-index with terciles indicated (T1, T2 – shaded area, T3). B. Boxplot of the same percentage, by h-index tercile. Medians, 1st – 3rd quartile ranges, non-outlier ranges and outliers (circles) are shown; P < 0.05 (*).

