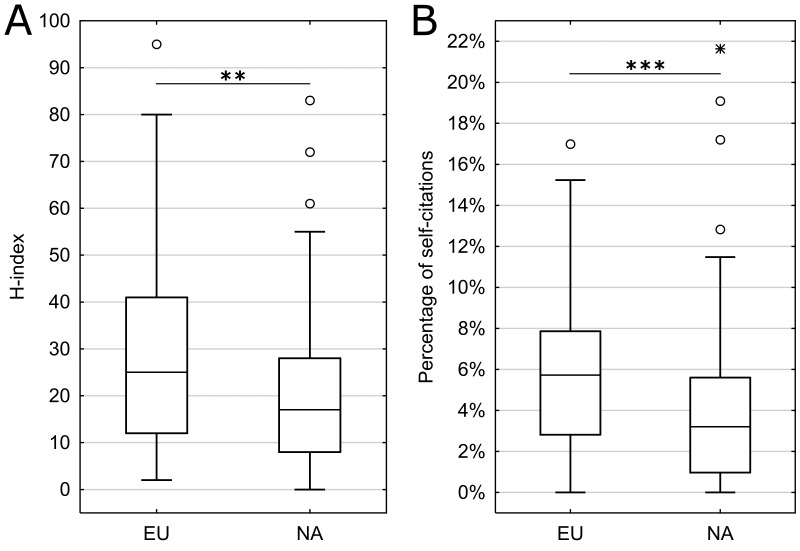
Figure 2.
Comparison between European and North American researchers. A. H-index compared between members of selected European (EU) and North American (NA) medical societies. B. Percentage of self-citations compared between members of selected EU and NA medical societies. Medians, 1st – 3rd quartile ranges, non-outlier ranges, outlier (circles) and extreme value (star) are shown; P < 0.01 (**), P < 0.001 (***).

