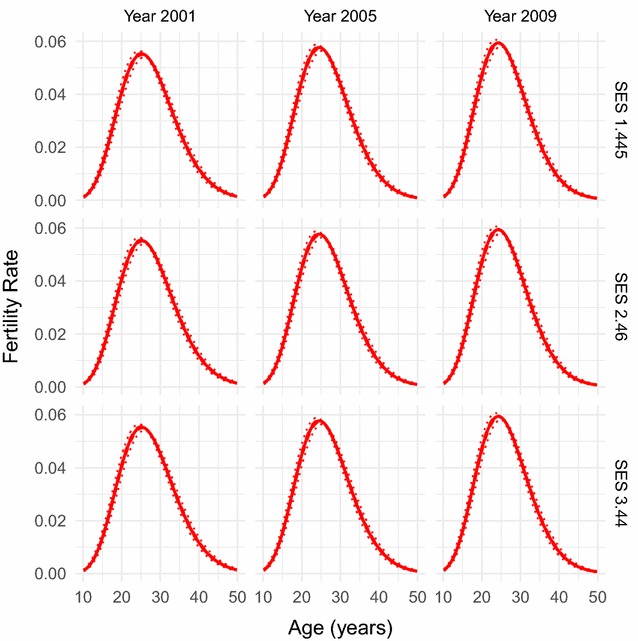
Fig. 3.

Fitted fertility rates over age. Fertility rate over age as fitted by our combined parametric and semi-parametric model, for socio-economic status values of 1.445, 2.46, and 3.44, and years 2001, 2005, and 2009. Parametrically bootstrapped confidence intervals (from 1000 samples of the model) are shown for the 50% level (dashed lines) and 95% level (dotted lines). The model has managed to capture the standard skewed hill-shape of the age-pattern as found in the raw data and in many fertility age-patterns in the literature
