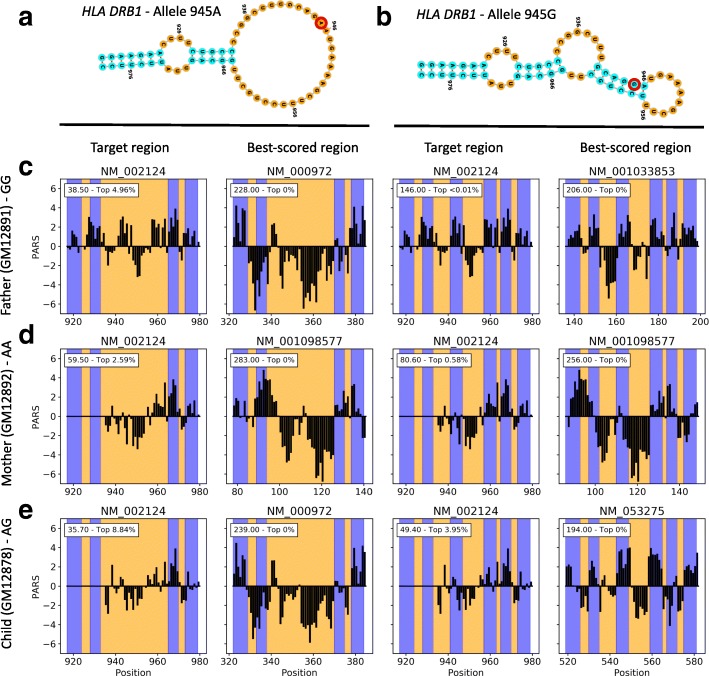
Fig. 5.
Transcriptome-wide search for the HLA-DRB1 riboSNitch motif in PARS data. Secondary structure models proposed in Wan et al. for allele variants 945A (a) and 945G (b) of the HLA-DRB1 riboSNitch. Red circles highlight the single nucleotide polymorphism. Search results were obtained for the father (homozygote G) (c), mother (homozygote A) (d), and child (heterozygote) (e) data sets. For each riboSNitch variant, PARS traces at both the target location, i.e., the location where the riboSNitch was first reported, and the best-scoring location across tested transcripts are shown. Blue regions indicate helices, i.e., paired nucleotides where positive PARS values are expected, and inversely for orange regions. The inset shows both the score and rank of the scored region relative to all scored regions, where a smaller rank indicates a region is among the best scored ones, with 0% indicating the top scored region

