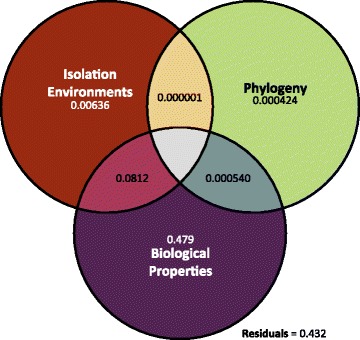
Fig. 2.

Variation in trait associations can largely be explained by biological properties. We used variance partitioning to measure the amount of variation in pairwise trait associations that could be explained by biological properties (purple), isolation environments (red), and phylogeny (green). Each circle represents a single factor, while the overlap among circles represents interactions among factors (e.g., the interaction between biological properties and isolation environments is represented by the pink area). The values provided in each area represent the amount each factor contributes to the variation. In total, the factors represented here explain 0.568 (or 56.8%) of the variance in trait associations. The residuals represent the proportion of the variance that is unexplained
