Fig. 3.

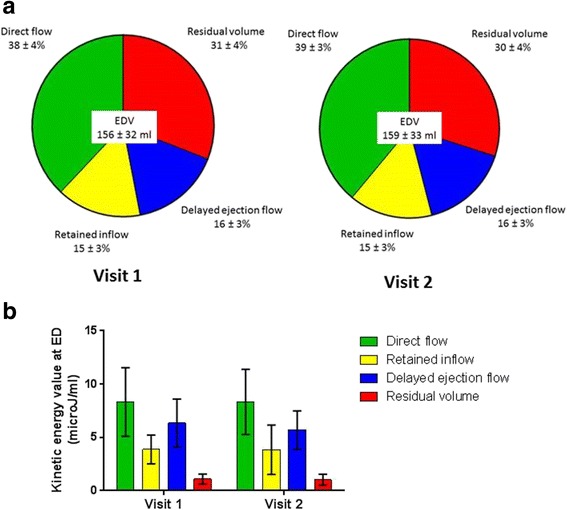
Interval scan popoulation differences in the 4 LV flow components for the 25 participants: a As percentage of EDV at visit 1 and 2. b Kinetic energy at end-diastole related to blood volume at visit 1 and 2

Interval scan popoulation differences in the 4 LV flow components for the 25 participants: a As percentage of EDV at visit 1 and 2. b Kinetic energy at end-diastole related to blood volume at visit 1 and 2