
Figure 2.
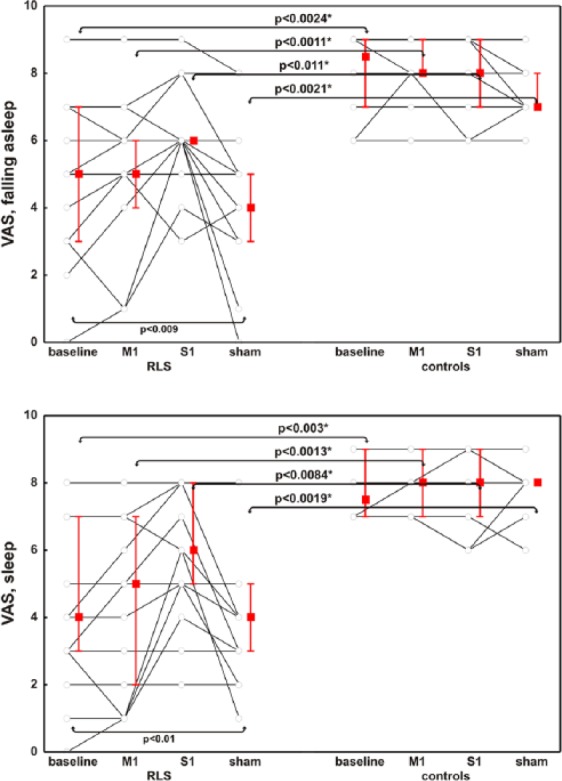
Subjective clinical effect on initiating and maintaining sleep, evaluated by means of a visual analog scale, in patients and controls with respect to the different stimulation modalities.
Data are presented as median (squares) and interquartile range (whiskers); each line identifies one patient or control. p values at the bottom are derived from the Friedman’s ANOVA and refer to the variations within the group (baseline/M1/S1/sham), whereas p values above the box/whiskers refer to the Mann–Whitney comparison between groups (RLS/controls); *significant after Bonferroni correction.
RLS, restless legs syndrome; M1, repetitive transcranial magnetic stimulation over the primary motor cortex; S1, repetitive transcranial magnetic stimulation over the primary somatosensory cortex; Sham, sham stimulation of M1; VAS, visual analog scale.