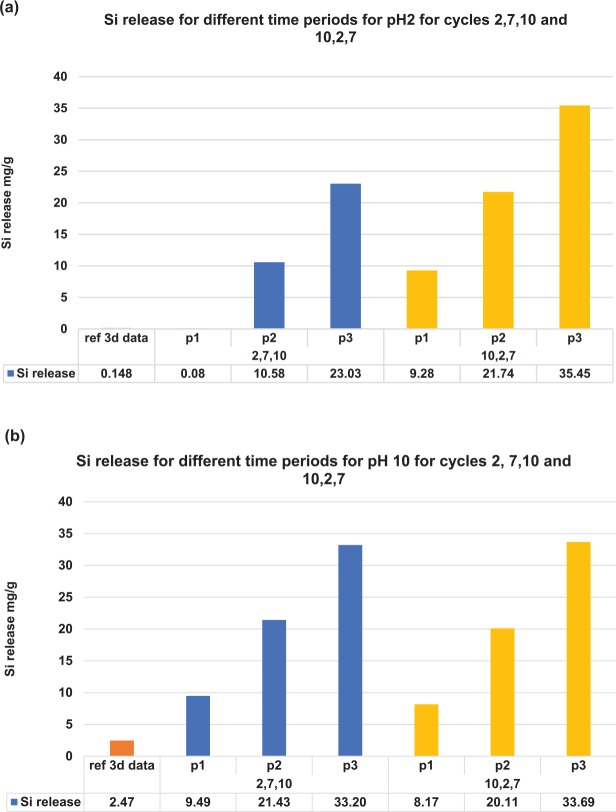
Figure 2.
Si release at different periods along the sequence 1 and 2 cycles. p1, p2, and p3: the periods in each cycle where Si release was recorded during which the sequence cycled to either pH 2 or pH 10. ref 3d data: 3-d data in the constant cycling experiment for pH 2 or 10. Si release levels for the cycling group in both sequences when it cycles to (a) pH 2 solution and (b) pH 10 solution.

