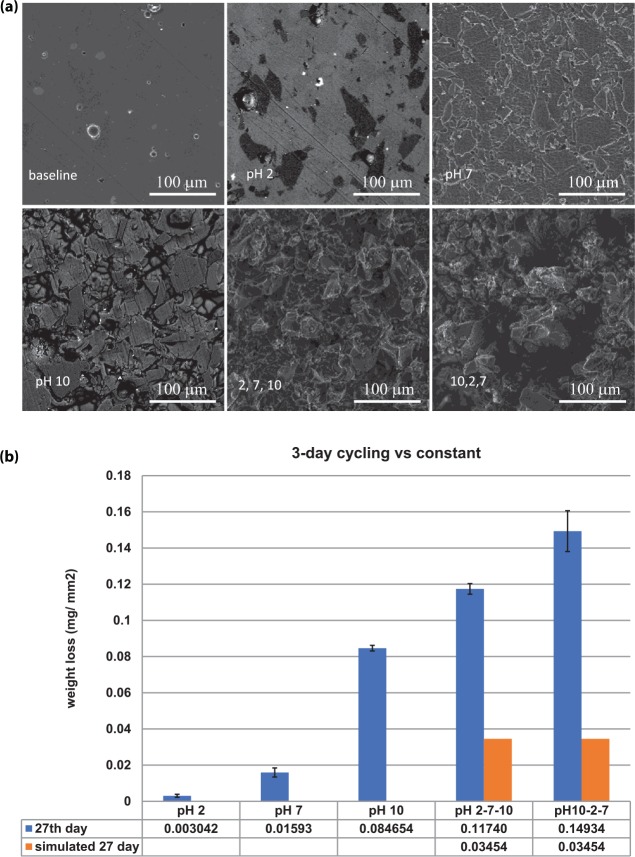
Figure 3.
Scanning electron microscopy and weight loss per area of cycling. (a) Baseline: untreated ceramic material. pH 2, 7, 10: ceramic material immersed in pH 2 solution for 27 d, pH 7 solution for 27 d, and pH 10 solution for 27 d, respectively. 2, 7, 10: ceramic material immersed in cycling pH sequence 1 solutions for 27 d. 10, 2, 7: ceramic material immersed in cycling pH sequence 2 solutions for 27 d. (b) Weight loss per area of cycling vs. constant immersion with simulated weight loss data. Values are presented as mean ± SD.

