Figure 3.
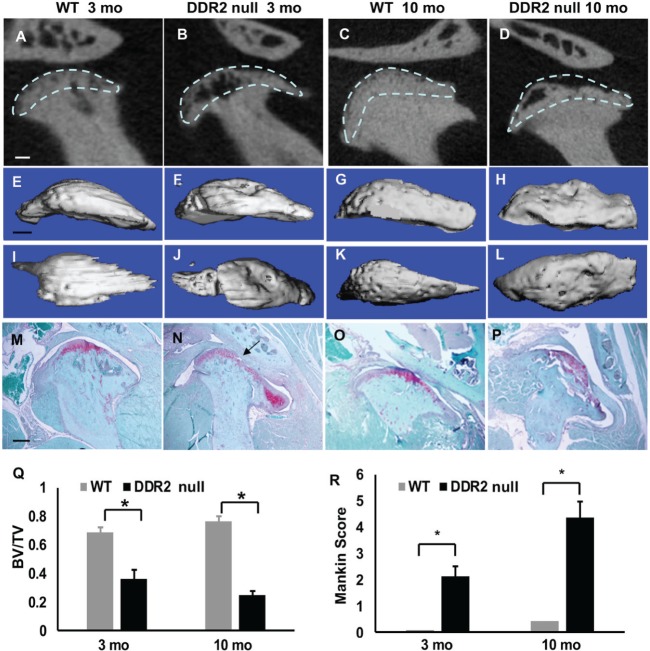
Spontaneous temporomandibular joint (TMJ) degeneration in 3- and 10-mo-old Ddr2slie/slie mice. (A–D) Two-dimensional micro–computed tomography (µCT) reconstruction images of TMJs from 3- and 10-mo-old wild-type (WT) and Ddr2slie/slie mice. (E–H) Three-dimensional µCT lateral views of mandibular condyles. (I–L) Three-dimensional superior views of mandibular condyles. (M–P) Safranin O staining of TMJ sections. Arrow in panel N indicates early degeneration in 3-mo-old DDR2-null section. (Q) µCT quantification of subchondral bone volume fraction at mandibular condyle surfaces (area of analysis indicated by dashed lines; see Materials and Methods). For panel Q, values are presented as ratio of bone volume / tissue volume; for panel R, as histopathologic score. (R) Histopathologic scoring of TMJ osteoarthritis based on modified Mankin score. Scale bars: 0.25 mm in panel A (A–D); 0.5 mm in panel E (E–L); 40 µm in panel M (M–P). *P < 0.05, n = 8.

