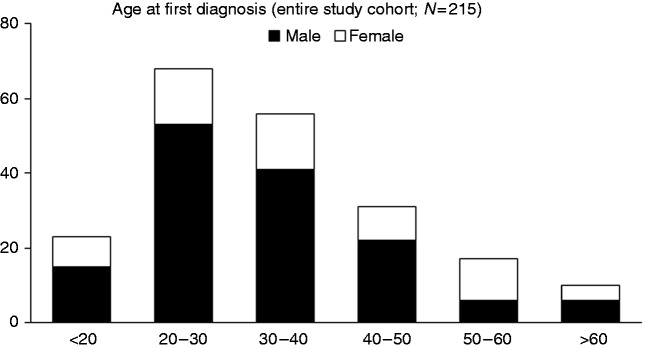
Figure 1.
Distribution of age at first diagnosis of PSC.
Distribution of age at first diagnosis of PSC differentiate into decades for the whole study cohort (N = 215) The number of patients is plotted on the y-axis. The sex ratio in patients with diagnosis after the age of 50 is significantly different compared with patients with earlier onset.

