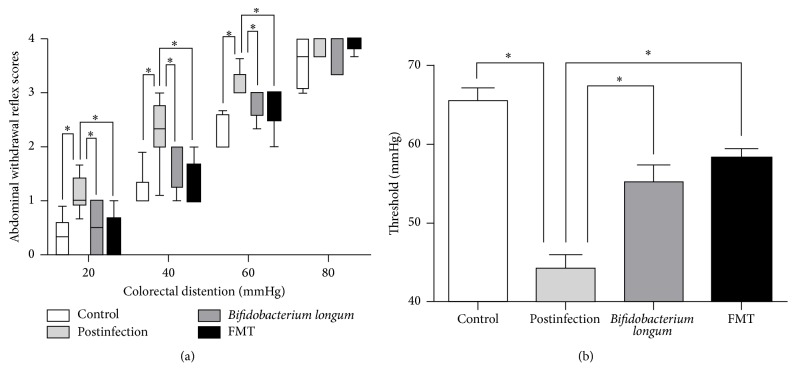
Figure 1.
Assessment of visceral sensation. (a) Box plot of the abdominal withdrawal reflex (AWR) scores. The lines in the boxes represent the medians, and the lines at the ends of the boxes represent the 25th and 75th percentiles. The error bars denote the 5th and 95th percentiles. (b) The threshold of colorectal distention (CRD) intensities that evoked abdominal contractions in the mice. The bar graphs are presented as the means ± SE; n ≥ 6 mice per group. Postinfection: PBS administration after infection. Bifidobacterium longum: Bifidobacterium longum administration after infection. FMT: fecal microbiota transplantation after infection. ∗p < 0.05.

