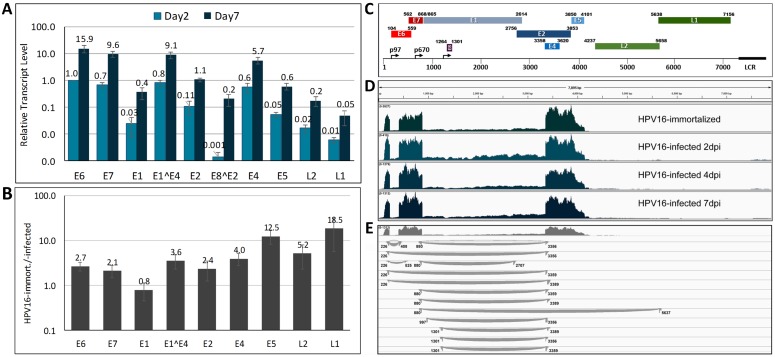
Fig 2. Analysis of viral transcripts by next generation RNA sequencing.
(A) Relative expression levels of individual viral ORFs in HPV16-infected HFK at 2 and 7 dpi. Cells grown in the presence of 10 μM Y-27632 were infected with HPV16 quasivirions via ECM-to-cell transfer and transcripts were quantified by RT-qPCR. The data shown are fold changes normalized to E6 transcript levels at 2 dpi of HFK. (B) RT-qPCR analysis of viral transcripts isolated from HPV16-immortalized HFKs and normalized to transcript levels in HPV16-infected HFKs at 10 dpi. (C) Schematic representation of the HPV16 genome and its ORFs. (D) Read depth maps of viral transcripts isolated from HPV16-infected HFK at 2, 4 and 7 dpi and from HPV-immortalized HFK of representative samples. (E) Detailed analysis of splice junctions of viral transcripts isolated from HFK at 7dpi. Each curved line represents a splice junction derived from individual reads that connects splice donor and acceptor sites.

