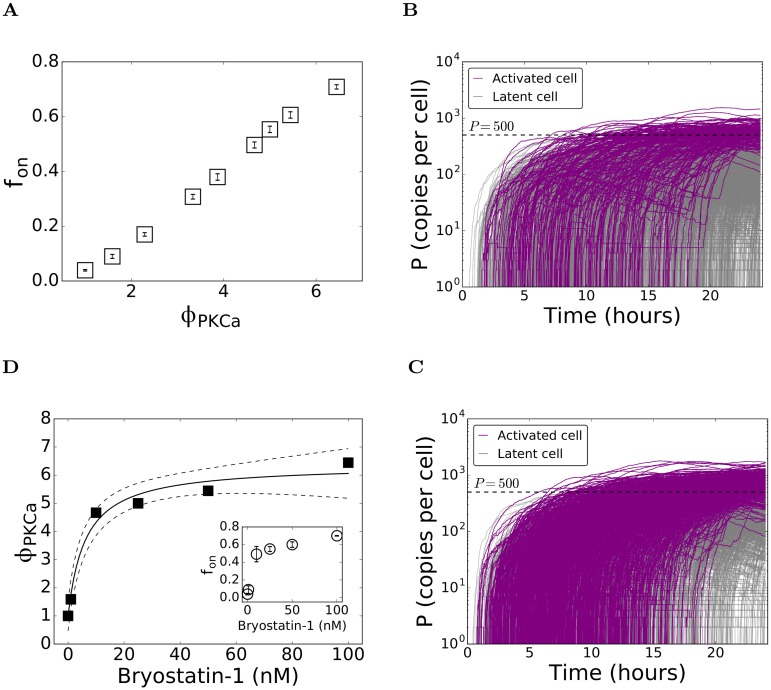
Fig 3. Influence of PKC agonists on latent cell reactivation.
(A) The fraction of cells reactivated, fon, as a function of the fold-increase, ϕPKCa, in the rate of NF-κB synthesis, predicted using our stochastic simulations (Methods). Representative realizations showing the time-evolution of protein copy numbers in activated (purple) and latent (grey) cells with (B) ϕPKCa = 1.76 yielding fon = 0.1 and (C) ϕPKCa = 3.87 yielding fon = 0.38. The remaining parameters are in Table 1. (D) Dose-response curve for bryostatin-1 obtained by mapping ϕPKCa to the dosage [D] (symbols) that yield the measured fon [33] (Inset). The best-fit of the Hill equation (Eq (22)) (solid line) and the 95% confidence interval (dashed lines) are also shown. The best-fit parameter estimates are ϕ0 = 5.3 ± 0.3 and ϕM = 6 ± 2 nM (R2 = 0.98).

