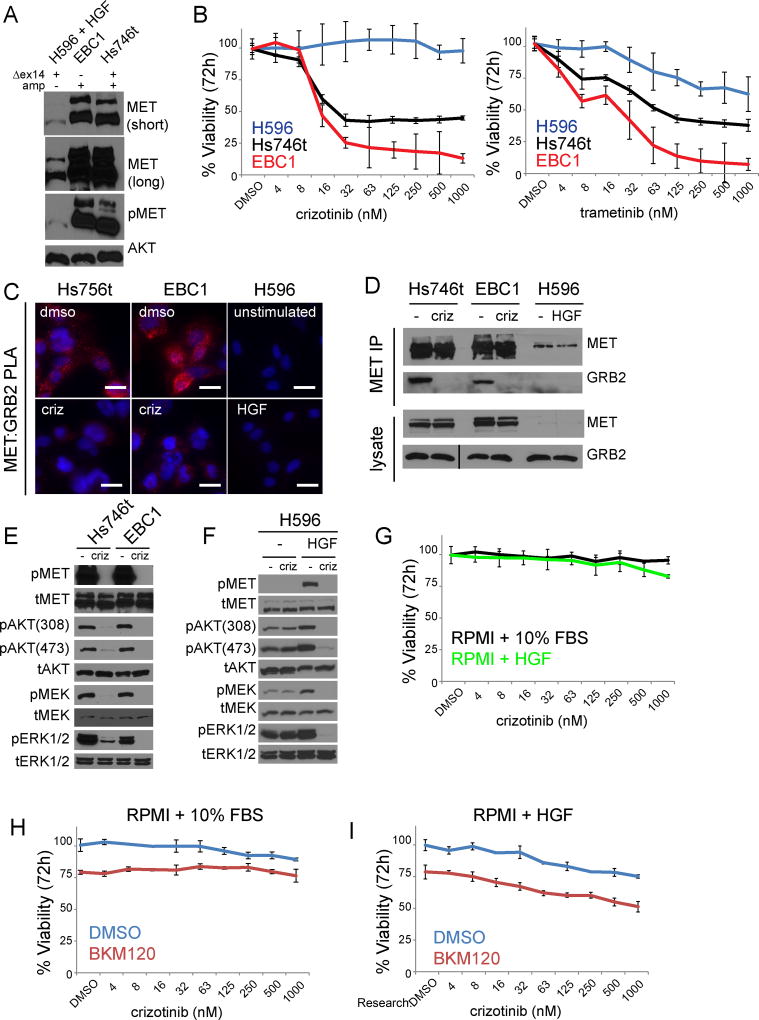
Figure 6. METΔexon14 mutation alone is not sufficient to impart sensitivity to MET TKI.
A) Immunoblot analysis of equal amounts of lysate (50µg) METΔex14 cell lines run on 6% acrylaminde gel. Total AKT serves as loading control. B) MET-amplified and METΔex14 expressing NSCLC cell lines analyzed by Cell Titer Glo 72 hr after crizotinib (left) and trametinib (right) treatment. Error bars represent standard deviation from triplicate wells of a representative experiment. C) PLA analysis of MET-amplified and METΔex14 expressing NSCLC cell lines, +/− 1µM crizotinib for 3hrs (Hs746t, EBC1) or +/− 100ng/ml HGF for 5 minutes (H596). Images are representative of three independent experiments, scale bars represent 20µm. D) Endogenous co-immunoprecipitation in MET-amplified NSCLC and METΔex14 expressing cell lines +/− crizotinib (3h 1µM). Line in total GRB2 blot represents second “crop box”, which was required due to a tear in acrylamide gel producing an artificial molecular weight shift. Image is the same exposure. E) Immunoblot showing downstream signaling in wt and ex14 mutant MET amplified lines, +/− crizotinib (3h 1µM). F Immunoblot showing downstream signaling in non-amplified MET ex14 mutant H596 cells +/− crizotinib (3h 1 µM) cultured in either RPMI1640 + 10% FBS or serum-free RPMI1640, then stimulated with HGF (100ng/ml, 5 minutes). G) H596 cells analyzed by Cell Titer Glo 72 hr after crizotinib cultured in either RPMI1640 + 10% FBS or serum-free RPMI1640 + 100ng/ml HGF. Each curve separately normalized to DMSO. Error bars represent standard deviation from triplicate wells of a representative experiment. H,I) H596 cells analyzed by Cell Titer Glo 72 hr after crizotinib cultured +/− 500nM BKM120 in either RPMI1640 + 10% FBS (H) or serum-free RPMI1640 + 100ng/ml HGF (I). Each curve normalized to the “double DMSO” in order to visualize the effect of BKM120 in the absence of crizotinib. Error bars represent standard deviation from triplicate wells of a representative experiment.

