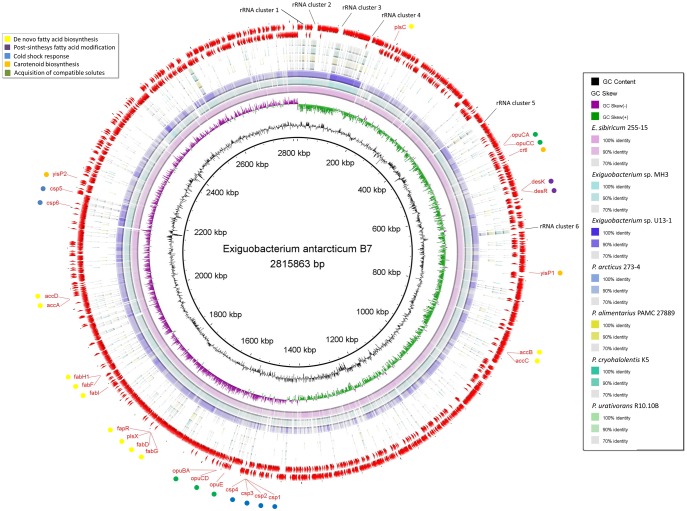
Fig. 1.
—Circular map designed to compare the nucleotide identity of all genomes against Exiguobacterium antarcticum B7. The genomes were compared by BLASTn, and the percent identity between them was determined by the intensity of color in the circular rings. The innermost ring to the outermost in this figure is presented as follows: the GC content and CG skew of E. antarcticum B7, the genomes of E. sibiricum 255-15, Exiguobacterium sp. MH3, Exiguobacterium sp. U13-1, Psychrobacter arcticus 273-4, P. alimentarius PAMC 27889, P. cryohalolentis K5, and P. urativorans R10.10B, respectively. The three outermost rings comprise the location of the GIs (yellow arcs) and CDSs (red arcs) of E. antarcticum B7. The main genes involved in cold adaptation are indicated by circles colored according to the metabolic pathway.

