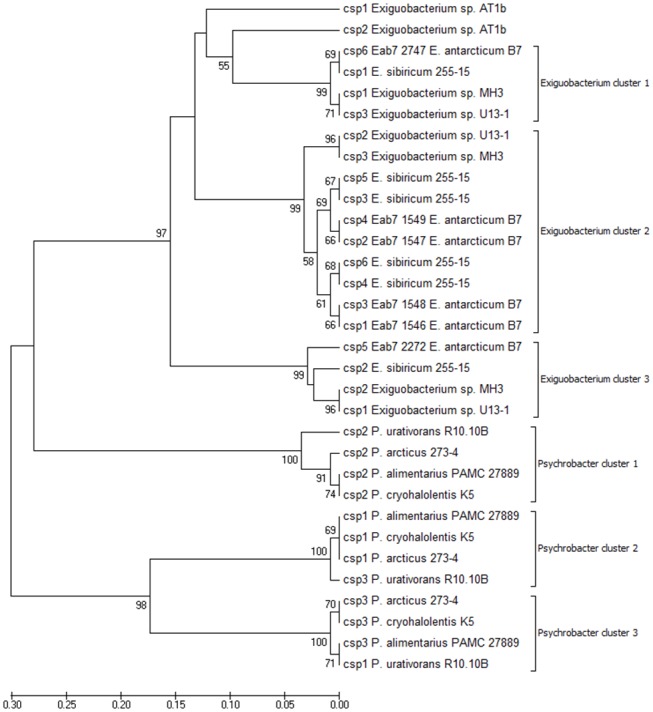
Fig. 4.

—Phenetic clustering of CSP sequences using the UPGMA method. The optimal tree with the sum of branch length = 1.74505027 is shown. The percentage of replicate trees in which the associated taxa clustered together in the bootstrap test (1,000 replicates) are shown next to the branches. Analyses was conducted in MEGA7.
