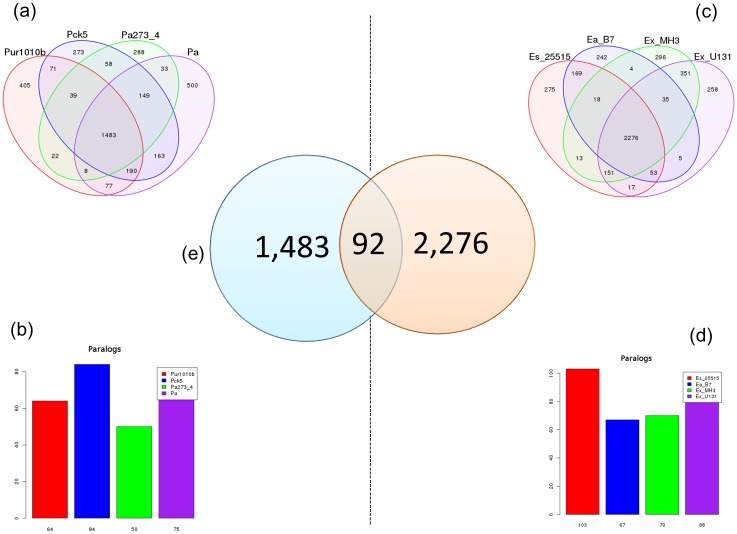
Fig. 5.
—Venn diagram and bar plots showing the results of the gene distribution calculated in PGAP. (a) Venn diagram with the number of genes shared among Psychrobacter urativorans R10.10B (red), P. cryohalolentis K5 (blue), P. arcticus 273-4 (green), and P. alimentarius PAMC 27889 (purple). (b) Bar plot showing the number of paralogous genes in each strain of Psychrobacter. (c) Venn diagram with the number of genes shared among Exiguobacterium sibiricum 255-15 (red), E. antarcticum B7 (blue), Exiguobacterium sp. MH3 (green), and Exiguobacterium sp. U13-1 (purple). (d) Bar plot showing the number of paralogous genes in each strain of Exiguobacterium. (e) Shared and singleton genes between the species of Exiguobacterium and Psychrobacter.

