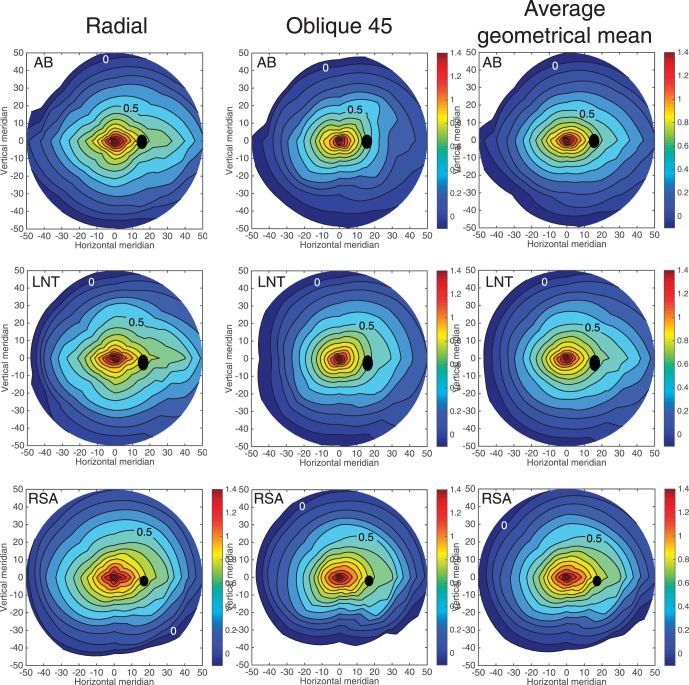
Figure 5.
Retinal contour maps of log-acuity for all three subjects. Left column of maps is for radially oriented fringes, middle column is for oblique fringes, and the right column is for the arithmetic average of the geometric means for the radial/tangential orientations and oblique orientations. Contours are spaced at 0.1 log spatial frequency intervals. For clarity, only the contours for log(1 c/°) and log(3.16 c/°) are labeled. Black circles show location and size of the blind spot caused by the optic nerve head as measured by manual perimetry for each subject. Horizontal and vertical retinal coordinates are in degrees of visual angle. Positive x-values indicate nasal retina and positive y-values indicate superior retina. Tabulated acuity data used to produce the contour maps are provided in a supplementary file.

