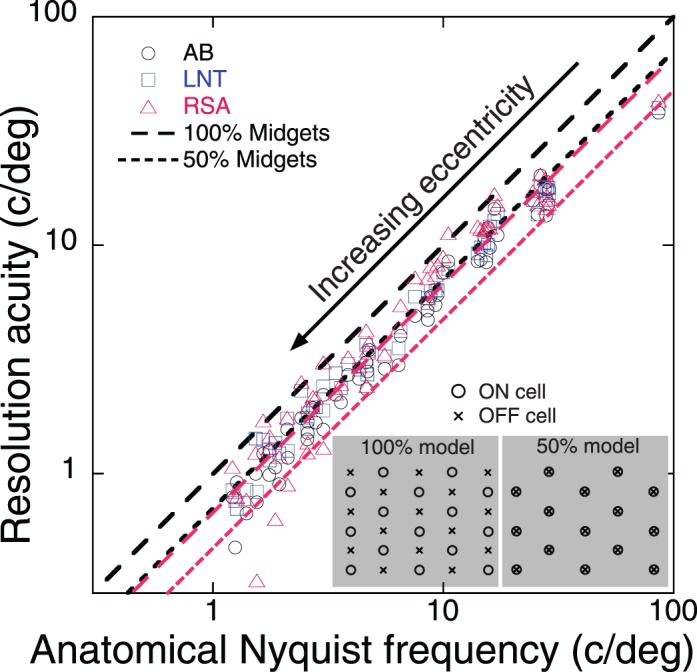
Figure 7.

Comparison of measured resolution acuity (symbols) with anatomical Nyquist frequency predicted by Watson's (2014) mathematical model of midget ganglion cell density. Dashed line is the prediction for sampling by 100% of midget ganglion cells, which we argue is appropriate for independent arrays of ON and OFF retinal ganglion cells that sample at maximally different locations. Dotted black line is the prediction for sampling by 50% of midget ganglion cells, which is appropriate for identical arrays of ON and OFF cells that sample the same retinal locations. Insets provide schematic diagrams of the two models. Red lines represent adjusted models for which the two black reference lines are shifted downward together so the 50% model fits the foveal data.
