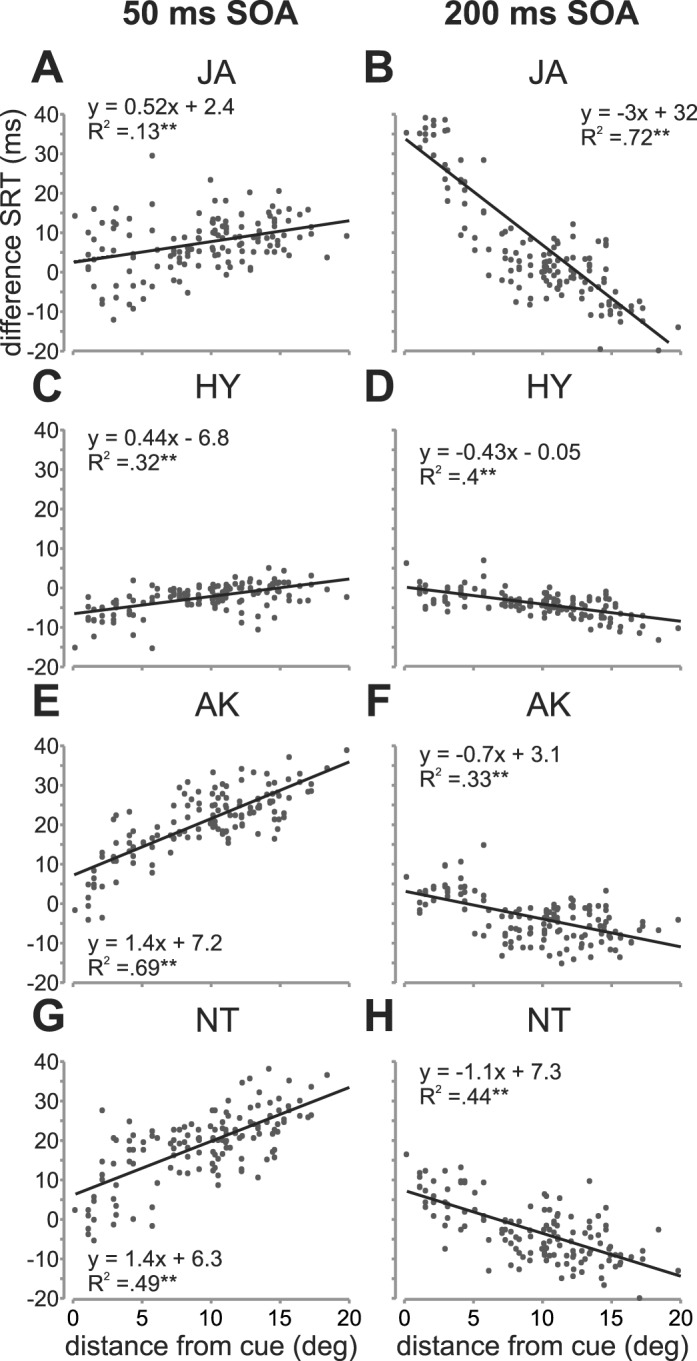
Figure 3.

DSRTs as a function of target-distractor distance. Median dSRTs are plotted as a function of the absolute distance between the target and the distractor separately for each subject (rows) and each SOA condition (columns). Linear fits to the dSRTs are shown along with the corresponding equations and R2 values. ** depict significance at p < 0.01.
