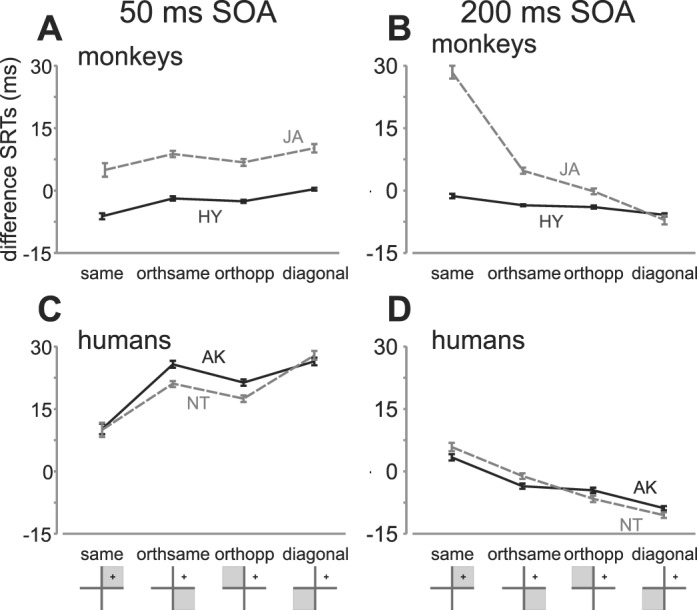
Figure 5.

DSRTs as a function of quadrant relative to distractor. Median dSRTs for each quadrant relative to the distractor are shown for monkeys (HY—solid black lines; JA—dashed gray lines; top row) and humans (AK and NT; bottom row) for the short (left column) and long (right column) SOA conditions. The four quadrant locations are depicted in the x-axis label as gray regions. Error bars are standard errors of the medians.
