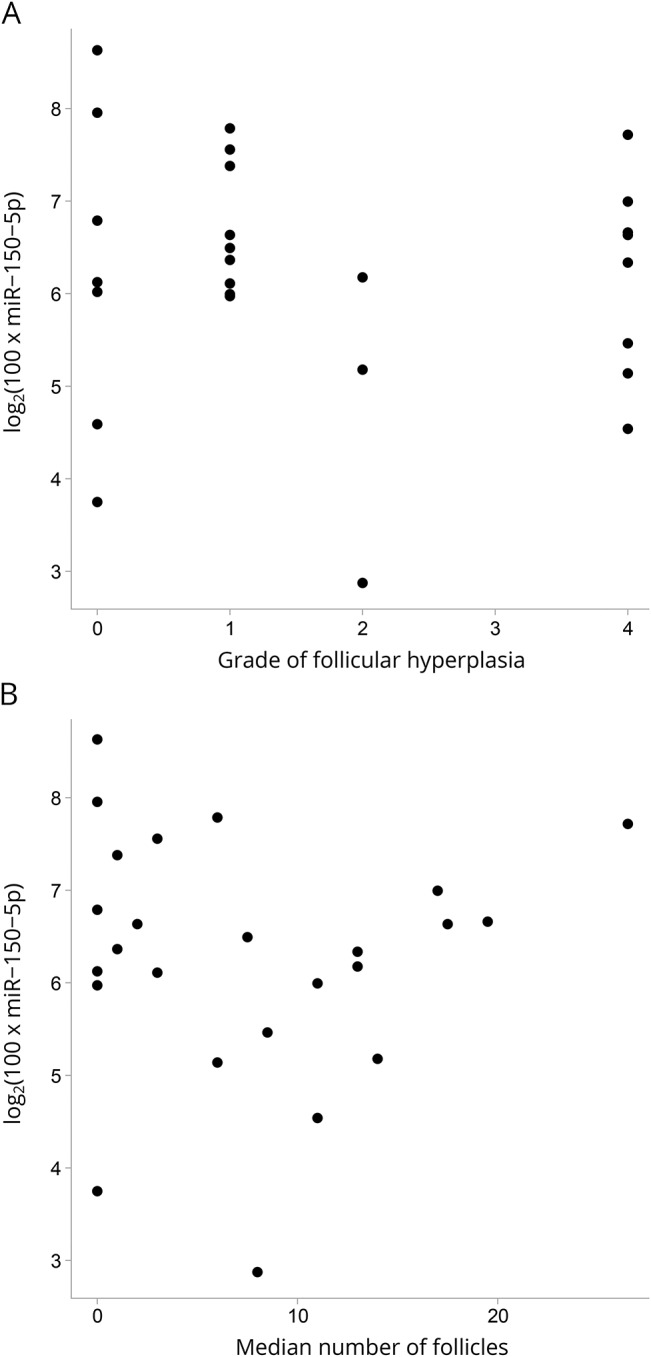
Figure 2. Thymus hyperplasia and miR-150-5p levels.

Scatter plot indicating miR-150-5p related to (A) the grade of thymic lymphofollicular hyperplasia (TFH) and (B) the median number of follicles.

Scatter plot indicating miR-150-5p related to (A) the grade of thymic lymphofollicular hyperplasia (TFH) and (B) the median number of follicles.