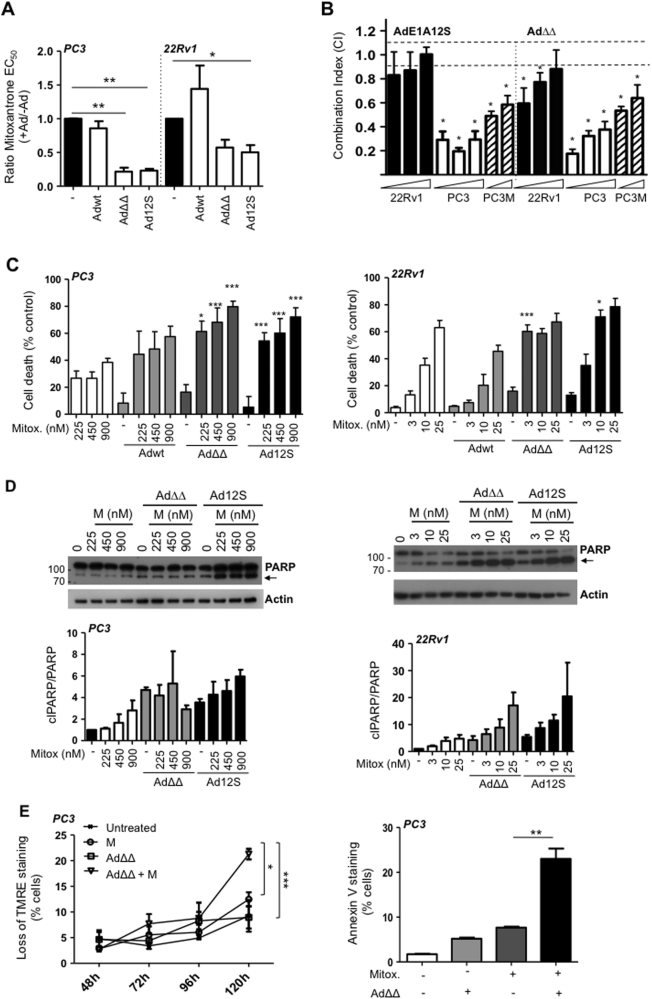
Fig. 1. AdΔΔ and AdE1A12S synergise with mitoxantrone to induce apoptotic cell killing in prostate cancer cells.
a Sensitisation to mitoxantrone by Ad5wt, Ad∆∆ and AdE1A12S in PC3 and 22Rv1 cells. Dose−response curves to mitoxantrone with and without fixed doses of virus killing 10–40% of cells alone; Ad5wt or AdΔΔ (1000 ppc; PC3 and 25 ppc;22Rv1) or AdE1A12S (5000 ppc;PC3and 100 ppc;22Rv1). Cell viability determined by MTS assays 5 (PC3) or 3 days (22Rv1) after treatment and data analysed by unpaired t-test, averages ± SEM, n ≥ 3, **p < 0.01, *p < 0.05. Ratios = EC50-values of combination/EC50-values mitoxantrone. b PC3 and 22Rv1 cells infected with Ad∆∆ or AdE1A12S and treated with mitoxantrone for 5 and 3 days, respectively, at three constant ratios (0.5, 2.5 and 12.5 ppc/nm; indicated by wedges) and PC3M cells at two constant ratios (2.5 and 12.5 ppc/nm). Combination indexes (CI) calculated from isobolograms and synergistic cell killing defined as CI ≤ 0.9; averages ± SD, n = 3, *p < 0.05 compared to the theoretical additive values (dashed lines; additive effects 0.9 < CI < 1.1). c PC3 cells (left panel) treated with mitoxantrone (225, 450 and 900 nm) and/or infected with Adwt and AdΔΔ at 500ppc or Ad12S at 5000ppc. Cell death indirectly determined using the MTS viability assay 5 days after treatment. One-way ANOVA with Tukey−Kramer post-test, averages ± SEM, n = 4. 22Rv1 cells (right panel) treated with mitoxantrone (3, 10 and 25 nm) and/or infected with Ad5wt and AdΔΔ at 15 ppc or Ad12S at 50 ppc. Number of dead cells determined by the Trypan blue exclusion assay after 3 days. Representative study, one-way ANOVA with Tukey−Kramer post-test, averages ± SEM from quadruplicate samples. *p < 0.05, ***p < 0.001, ****p < 0.0001, *compared to the theoretical additive value of mitoxantrone and virus, n ≥ 3. d Expression of PARP detected by immunoblotting (cleaved PARP indicated with black arrows; 89 kDa), one representative immunoblot, n = 3. PC3 cells (left panel) infected with AdΔΔ (500 ppc) or AdE1A12S (5000 ppc) and/or mitoxantrone (225, 450 or 900 nm). 22Rv1 cells (right panel) infected with AdΔΔ (15 ppc) or AdE1A12S (50 ppc) and/or mitoxantrone (3, 10 or 25 nm). Cells were lysed 48 h after treatment. Lower panels: PARP ratios; cleaved PARP (clPARP/PARP) after quantification by densitometry and normalised to the actin loading control, expressed as fold-change relative to the untreated control, n = 3. Molecular weight markers indicated in kDa. e PC3 cells analysed at the indicated time points for mitochondrial depolarisation by loss of TMRE staining using flow cytometry (left panel) and Annexin V staining (right panel) 120 h after infection with AdΔΔ (500 ppc) and/or treated with mitoxantrone (450 nm). One-way ANOVA with Tukey−Kramer post-test *p < 0.05, **p < 0.01, ***p < 0.001, n = 3

