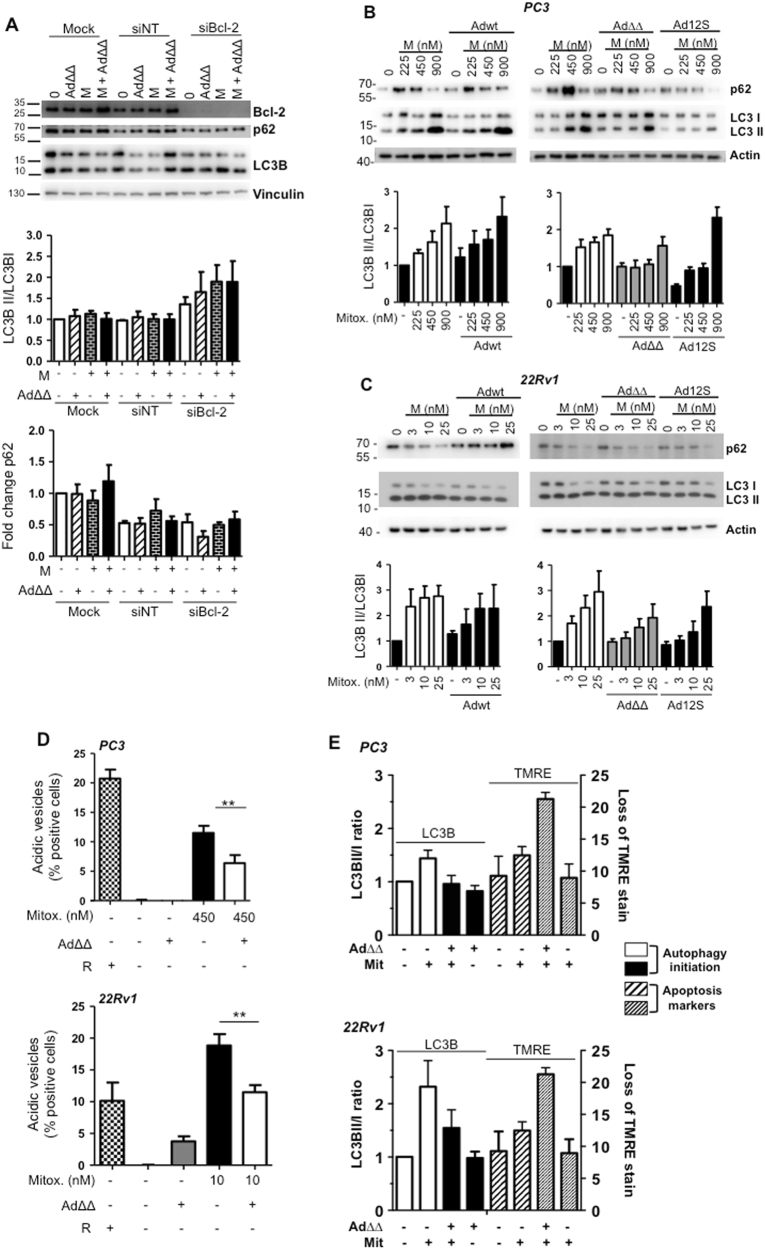
Fig. 3. AdΔΔ or AdE1A12S attenuate mitoxantrone-induced autophagy that is dependent on Bcl-2 expression.
a Infection of PC3 cells with AdΔΔ (500 ppc) and/or treatment with mitoxantrone (450 nm), 4 days after transfection with non-targeting siRNA (siNT) or targeting siRNA (siBcl-2) or mock transfection (Dharmafect reagent) 48 h after treatment and immunoblotted for Bcl-2, p62, LC3B, representative blot. LC3BII/I ratios quantified by densitometry analysis, normalised to the loading control and expressed as fold-change relative to the untreated control, n = 3. b, c Immunoblotting for p62 and LC3BII/I proteins, b PC3 cells treated with mitoxantrone (M; 225, 450, 900 nm) and/or infected with Ad5wt or AdΔΔ (500 ppc) and AdE1A12S (5000 ppc), and c 22Rv1 cells treated with mitoxantrone (3, 10, 25 nm) and/or infected with Ad5wt or AdΔΔ (20 ppc) and AdE1A12S (100 ppc), representative blots, quantification as in a, n = 3–6. d Lysotracker staining to detect acidic vesicles using flow cytometry. PC3 cells treated with mitoxantrone (450 nm), AdΔΔ (500 ppc) or in combination for 120 h, and 22Rv1 cells treated with mitoxantrone (10 nm) or AdΔΔ (20 ppc) or in combination for 72 h. One-way ANOVA with Tukey−Kramer post-test, **p < 0.01, n = 4. Rapamycin (50 nm) was used as a positive control. e LC3II/I ratios from immunoblotting data and apoptosis determined by loss of TMRE staining (120 h; PC3 and 72 h; 22Rv1). In all assays cells were treated with mitoxantrone at 10 nm (22Rv1), at 450 nm (PC3) and/or infected with AdΔΔ (20 ppc; 22Rv1 and 500 ppc; PC3), n = 3–6

