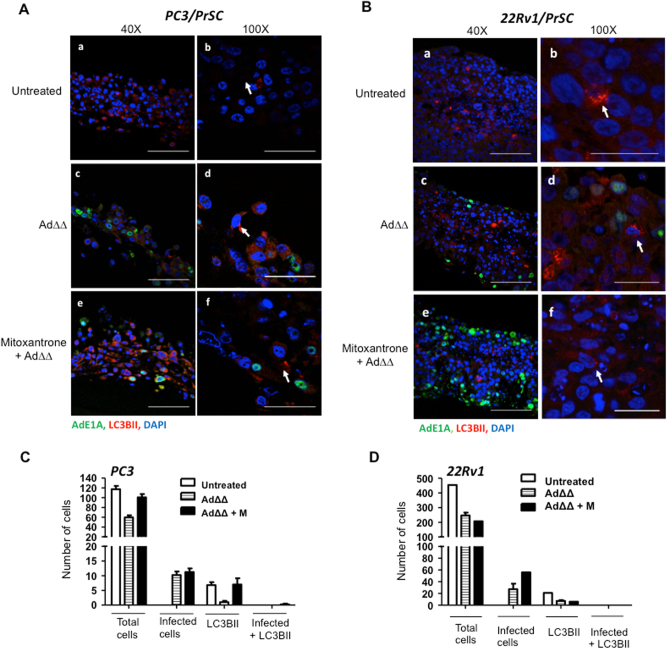
Fig. 5. AdΔΔ-infected cells do not express LC3BII in 3-dimenasional co-cultures of PrSC and PC3 or 22Rv1 cells.
a PC3 and PrSC cells seeded on top of collagen/matrigel matrices and fixed 8 days after seeding, stained for the early viral E1A and cellular LC3BII proteins and nuclei visualised by DAPI using confocal microscopy. a, b Untreated control. c, d Cells infected on days 3 and 5 with AdΔΔ (1000 ppc). e, f Cells treated on days 3 and 5 with mitoxantrone (450 nm) and infected with AdΔΔ. Scale bars: ×40 = 100 µm and ×100 = 50 µm. b 22Rv1 and PrSC cells seeded on top of collagen/matrigel matrices and fixed 10 days after seeding. Staining as in a. a-b. Untreated control. c−d. Cells infected on days 2 and 6 with AdΔΔ (100 ppc). e-f. Cells treated on days 2 and 6 with mitoxantrone (25 nm) and infected with AdΔΔ. Scale bars: ×40 = 100 µm and ×100 = 25 µm. a, b White arrows indicate LC3BII-positive cells. All sections stained with AdE1A (green), LC3II (red) and nuclei (blue). c,d Histograms of quantification of the total number of cells and cells positive for E1A or LC3BII staining per section at ×40 (a: PC3 and b: 22Rv1), n = 1 with 3–4 sections quantified/per condition

