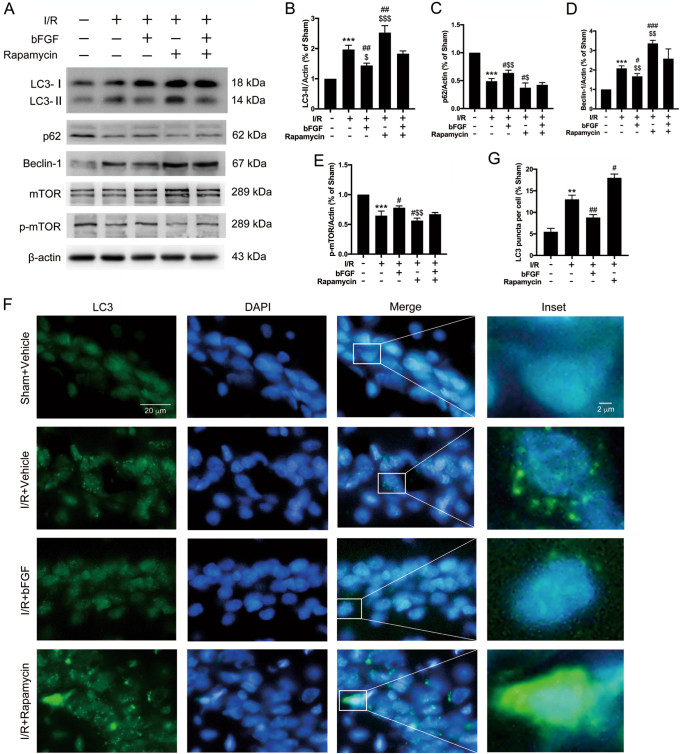
Fig. 6. The neuroprotective effect of bFGF after global cerebral I/R functioned by restraining excessive autophagy via the mTOR pathway.
a Immunoblots of LC3, p62, Beclin-1, mTOR, and p-mTOR was assessed with β-actin as a loading control. b-e Densitometric analysis (mean ± SEM, n = 3 animals per group) of the proteins from (A) normalized to the respective loading controls. f Representative immunofluorescence images of LC3 (green) and DAPI (blue) double staining in medial CA1 region 24 h after I/R. g Quantitative analysis of LC3B puncta per cell. More than 30 cells per condition were included. The data are presented as the mean ± SEM. ***P < 0.001 vs. sham + vehicle; #P < 0.05, ##P < 0.01, ###P < 0.001 vs. I/R + vehicle group; $P < 0.05, $$P < 0.01, $$$P < 0.001 vs. I/R + bFGF + rapamycin group

