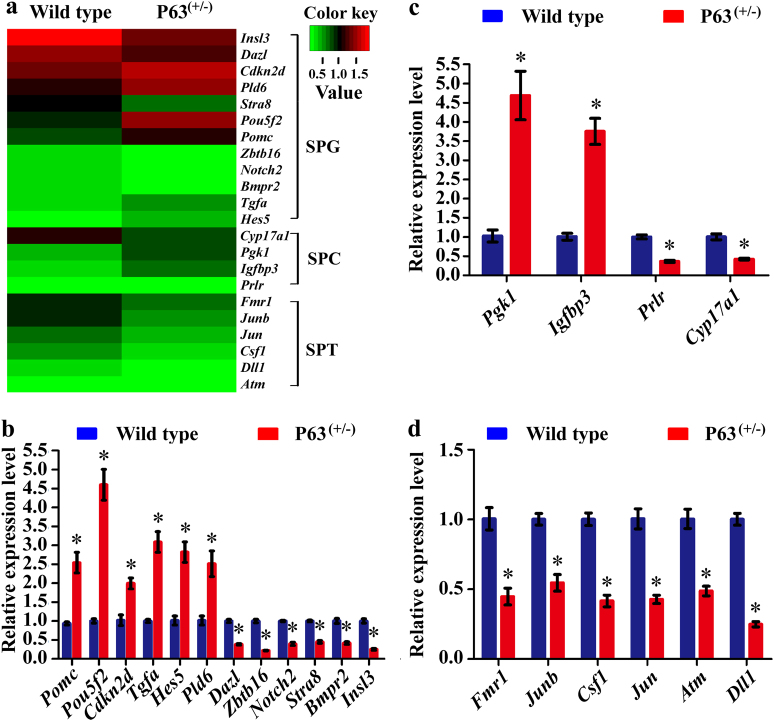
Fig. 8. The DEGs in spermatogonia, pachytene spermatocytes and round spermatids between P63(+/−) mice and wild-type mice.
Hierarchical clustering analysis showed 12 DEGs in spermatogonia (SPG), 4 DEGs in pachytene spermatocytes (SPC), and 6 DEGs in round spermatids (SPT) between P63(+/−) mice and wild-type mice a. Real-time PCR verified 12 DEGs in spermatogonia b, 4 DEGs in pachytene spermatocytes c and 6 DEGs in round spermatids d between P63(+/−) mice and wild-type mice. * indicated statistically significant differences (p < 0.05) between P63(+/−) mice and wild-type mice. The data in Fig. 8b–d were presented from three independent experiments

