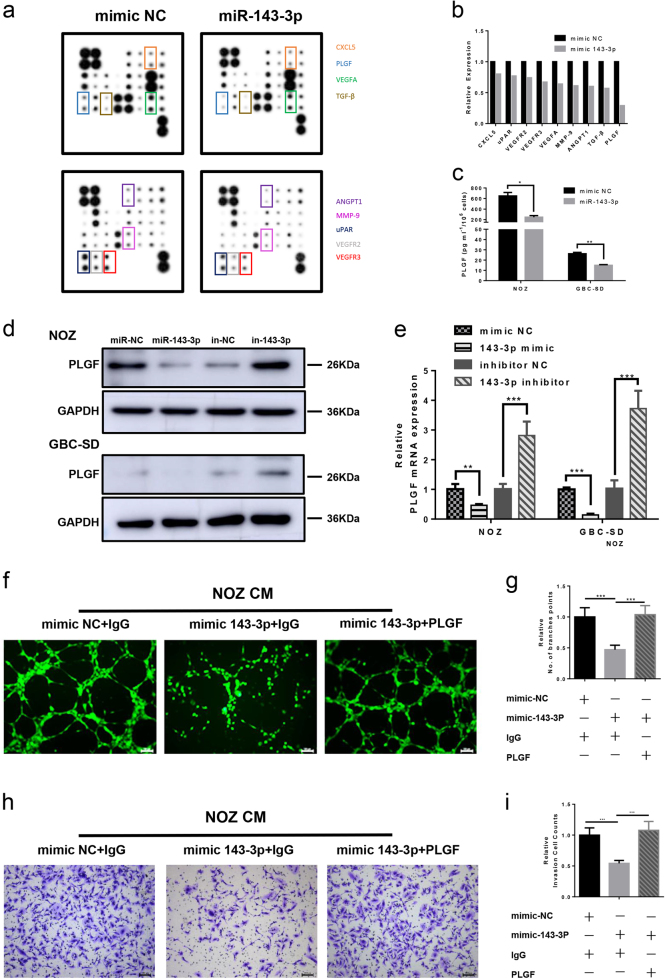
Fig. 4. miR-143-3p inhibits expression of PLGF.
a Human angiogenesis array analysis of the conditional medium from NOZ-mimic-NC and NOZ-miR-143-3p mimic cells. b A summary of the relative expression levels of the angiogenesis cytokines is provided in the bar graph. c PLGF in the supernatants of the NOZ and GBC-SD cells that were transfected with mimic NC or the miR-143-3p mimics were quantified by ELISA (n = 3; *P < 0.05, **P < 0.01; Student’s t test). d, e PLGF expression in the mimic (inhibitor) NC and miR-143-3p mimics (inhibitors)-transfected GBC cells was analysed by western blot and qRT-PCR analysis. GAPDH was used as the loading control. f, g Endothelial tube formation estimation after incubation of HMVECs with conditioned medium from mimic NC or miR-143-3p cancer cells with or without PLGF. The number of branches was quantified (P < 0.001; Student’s t test). h, i Invasion of HMVECs through the Matrigel chambers after incubation with conditioned medium from mimic NC or miR-143-3p cancer cells with or without PLGF. Scale bar, 100 µm. The number of invading cells was determined and is depicted in the bar graph (***P < 0.001; Student’s t test)

