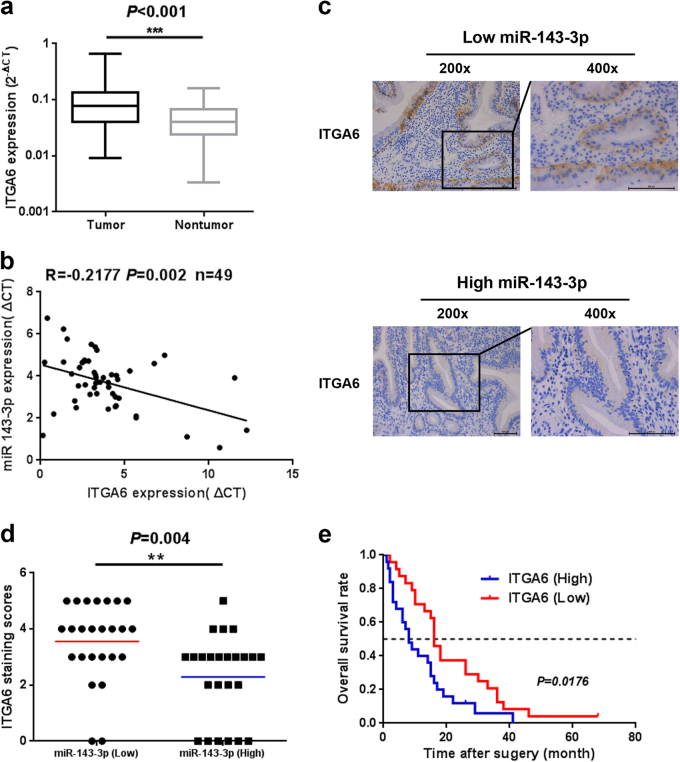
Fig. 6. ITGA6 expression at the mRNA level in human GBC tissues.
a The ITGA6 mRNA levels in 49 pairs of GBC tissues and their corresponding NATs. b The correlation between the expression levels of miR-143-3p and ITGA6 was determined using a linear regression analysis and a paired t test with the same samples used (P < 0.001, r = −0.2177, n = 49; Pearson’s correlation). c Representative IHC micrographs showing ITGA6 protein expression in GBC tissues with high or low miR-143-3p expression. Scale bar, 100 µm. d Scatterplots of the average staining scores of ITGA6 expression in the miR-143-3p-high or miR-143-3p-low tissues (**P < 0.01, n = 25 for miR-143-3p-low group; n = 24 for miR-143-3p high group). (e) Kaplan−Meier overall survival curve of GBC patients based on ITGA6 expression (P < 0.05, n = 49)

