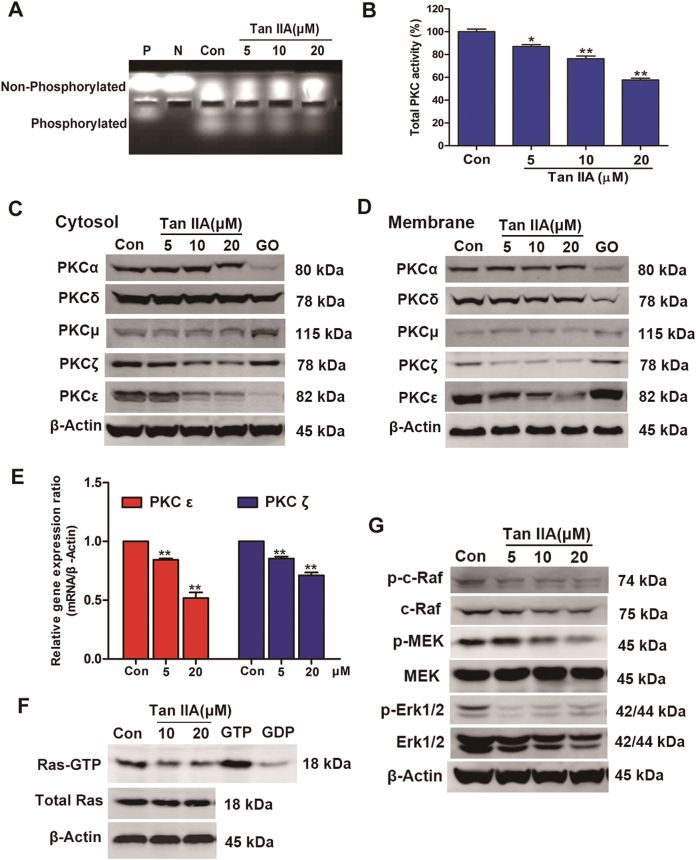
Fig. 6. Inhibitory effects exerted by Tan IIA on PKC and Ras/MAPK pathway.
a Lysate samples prepared from Tan IIA (5, 10, and 20 μM, respectively) treated MCF-7 cells were examined for PKC activity using the PepTag® assay. “Con” represents lysate sample from untreated MCF-7 cells, “P” for positive control (20 ng purified PKC), and “N” for negative control (water only). b Quantification results of the phosphorylated PepTag peptides for PKC activity. Data shown are mean ± standard deviation of three independent experiments. *p < 0.05 and **p < 0.01 when compared to the control. c Western blot analysis of MCF-7 cells treated with Tan IIA at the specified concentrations for the expression of cytosolic PKC isoforms. The compound Go 6983 (GO, 20 μM) was included as a positive control. d Similar analysis as that described in (C) except membrane fractions were used to monitor the levels of membrane PKC isoforms. e The expression levels of PKCε and PKCζ genes in MCF-7 cells treated with Tan IIA were determined by real-time PCR. Data shown are mean ± standard deviation of three independent experiments. *p < 0.05 and **p < 0.01 when compared to the control. f Ras activation monitored using a pull-down assay followed by western blot for the levels of GTP-bound active Ras in control and Tan IIA (10 and 20 μM, 24 h)-treated MCF-7 cells. The levels of total Ras and β-actin proteins were determined to serve as a reference for comparison. Lysate samples prepared from untreated control were incubated with GTP and GDP as positive and negative controls, respectively. g Effects of Tan IIA on the activity of the Ras/MAPK pathway. Following Tan IIA treatment of MCF-7 cells, the levels of active c-Raf (p-c-Raf), MEK (p-MEK), and Erk1/2 (p-Erk1/2) were determined by western blot. The levels of total c-Raf, MEK, and Erk1/2 proteins were also determined for comparison

