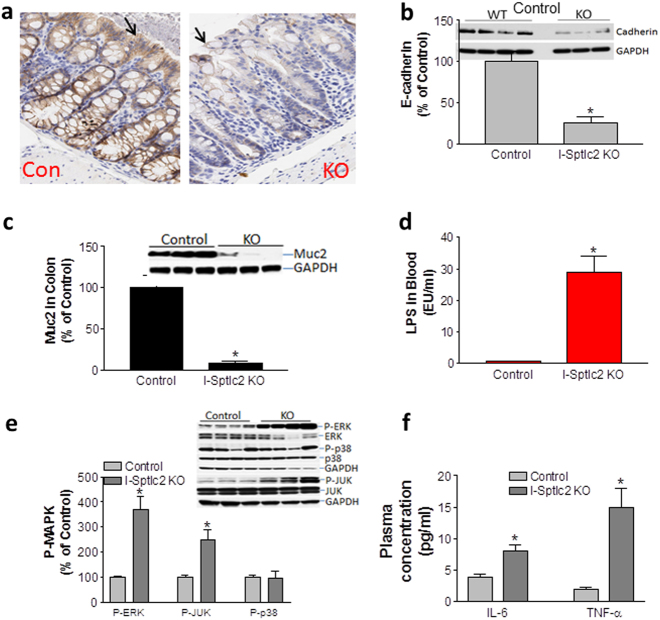
Fig. 4. Effect of Sptlc2 deficiency on cadherin, mucin2, and MAP kinases in the colon.
a Immunostaining for E-cadherin in the colon. Black arrows indicate the top part of crypts. b Western-blot fluorogram and quantification of E-cadherin in the colon. c Western-blot fluorogram and quantification of mucin2. d LPS level in mouse plasma. e Western-blot fluorogram and quantification of phospho-ERK and total ERK, phospho-JNK and total JNK, and phospho-p38 and total p38 in the colon of Sptlc2-deficient and control mice. f Plasma IL-6 and TNF-α measurement. Values represent the mean ± SD, n = 5, *P < 0.01. CON control, KO intestine-specific Sptlc2 knockout

