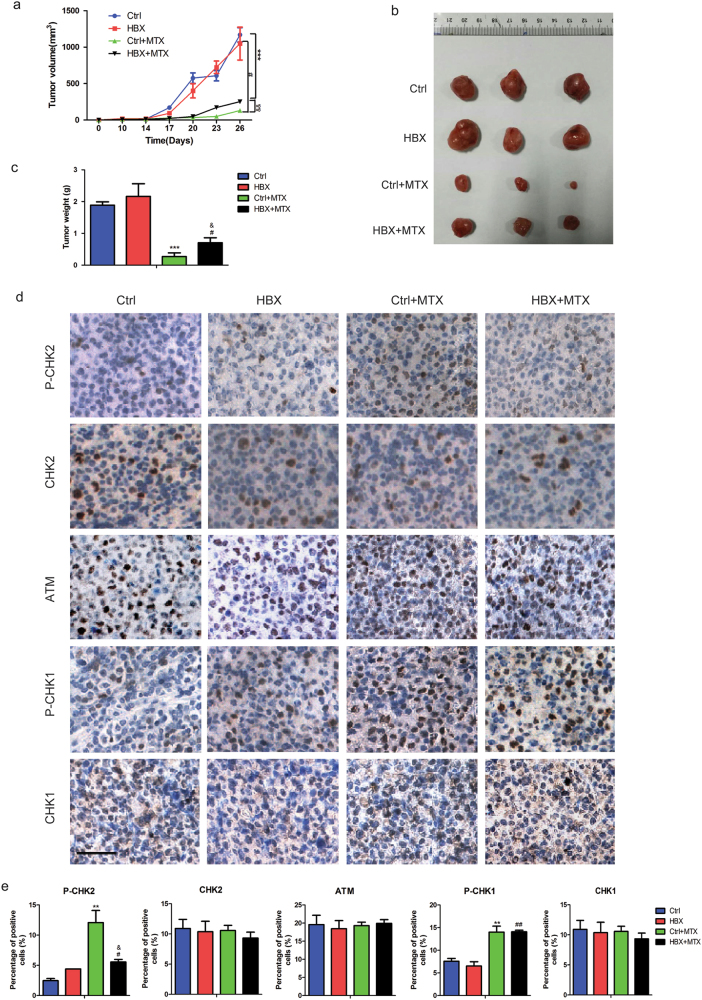
Fig. 5. HBX confers resistance to chemotherapy in vivo.
a Tumor volumes were measured every 3 days after day 14 post-injection in the indicated groups (n = 3 per group). b, c Representative images b, and weight statistics c, of tumors isolated from the mice for one of the batches at day 26 post-injection. d Immunohistochemical analysis of tumor sections from four groups using the indicated antibodies (P-CHK2, CHK2, ATM, P-CHK1, and CHK1). Scale bar, 25 μm. e Histogram statistics for the cells positive for the indicated proteins are shown. “*” Represents Ctrl + MTX versus Ctrl: **P < 0.01, ***P < 0.001. “#” Represents HBX + MTX versus HBX: #P < 0.05,## P < 0.01. “&” Represents HBX + MTX versus Ctrl + MTX: &P < 0.05,&&P < 0.01

