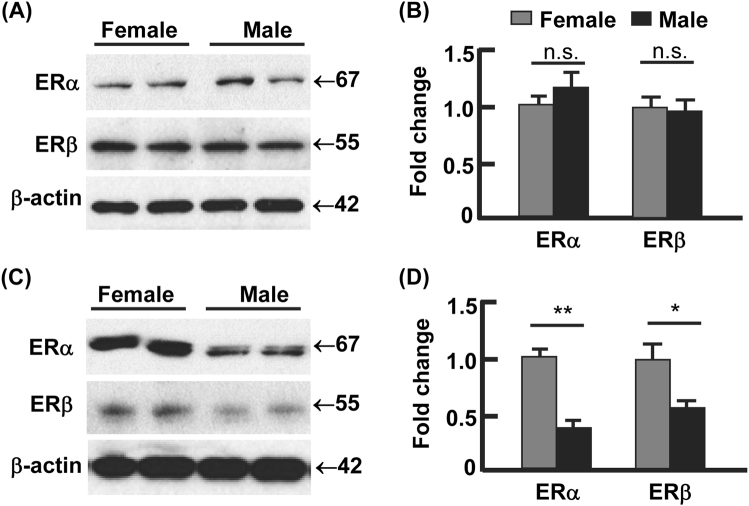
Fig. 3. The expression of estrogen receptors (ER) showed gender difference in visceral but not subcutaneous fat.
a–b The protein levels of ERα and ERβ in subcutaneous WAT, analyzed by Western blotting (a) and densitometry (b). c–d The protein levels of ERα and ERβ in visceral WAT, analyzed by Western blotting (c) and densitometry (d). In densitometric analysis, the band densities of investigated proteins were normalized against that of β-actin, and the fold changes were calculated by taking the normalized density of female group as “1”. *p < 0.05; **p < 0.01; n.s. not significant; n = 3–4

