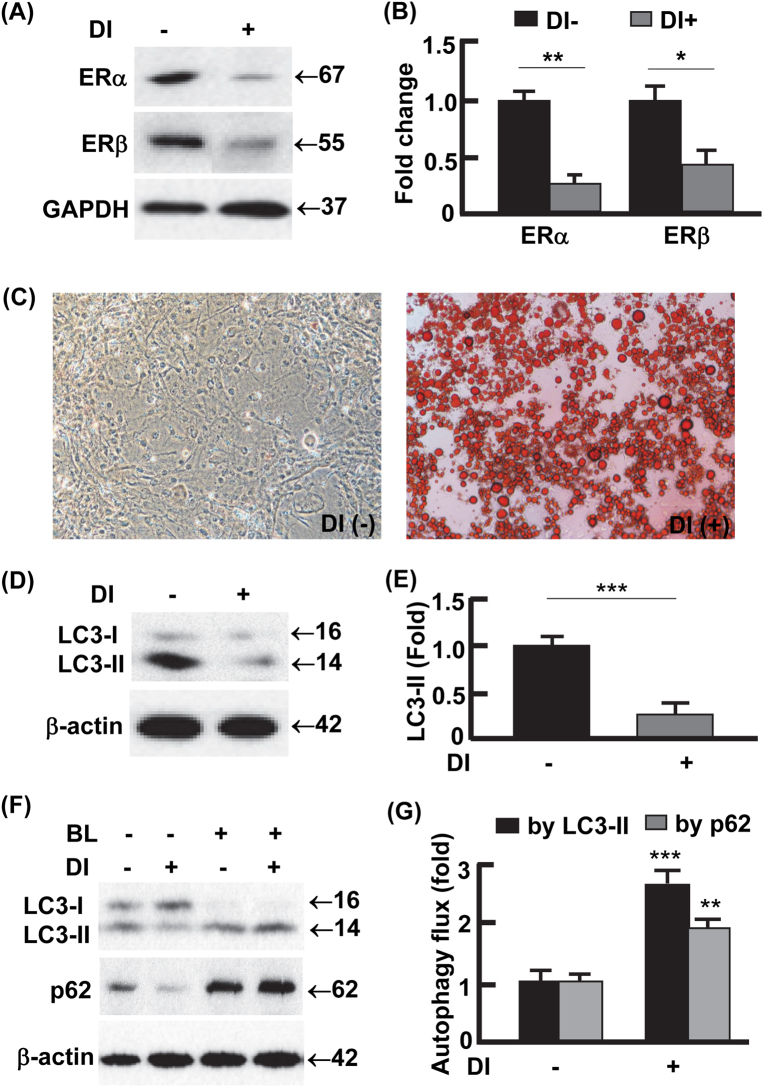
Fig. 4. Adipogenesis was associated with downregulation of ER but upregulation of autophagy activity.
a–b The protein levels of ERα and ERβ in preadipocytes and mature (or differentiated) adipocytes, analyzed by Western blotting (a) and densitometry (b). DI differentiation induction. DI+ represents differentiated 3T3L1 cells (mature adipocytes) harvested on day 12; DI− represents 3T3L1 cells without differentiation induction (i.e., preadipocytes) harvested on day 12. c Oil Red O staining to detect the differentiation of preadipocytes into mature adipocytes. On day 12, massive lipid accumulation was detected in mature adipocytes but not in preadipocytes. d, e The steady-state protein levels of LC3 in preadipocytes and mature adipocytes, analyzed by Western blotting (d) and densitometry (e) on day 12. f, g Measurement of autophagy flux in preadipocytes and mature adipocytes. On day 12, the cells were incubated in the presence or absence of autophagy inhibitor BL (bafilomycin A1 at 0.1 μM and leupeptin at 10 μg/ml) for 4 h, and the turnovers of LC3-II and p62 were examined by Western blotting (f) and densitometry (g). In densitometric analysis, the band densities of investigated proteins were normalized against that of GAPDH or β-actin, and the fold changes were calculated by taking the normalized density of DI− group as “1”. For autophagy flux analysis, we first normalized the band densities of LC3-II and p62 against that of β-actin, then calculated the differences of normalized densities in the presence vs. the absence of autophagy inhibitor; lastly, the differences were shown as fold changes by taking the DI− group as “1”. BL bafilomycin A1 and leupeptin. *p < 0.05; **p < 0.01; ***p < 0.0001; n = 3–4

